CoinGape has been covering cryptocurrency and blockchain markets since 2017. Our editorial team evaluates projects and platforms using structured review frameworks focused on transparency, utility, and risk assessment. You can explore our review methodologies to see how we assess and rate different categories. We maintain clear editorial standards and disclose advertising or affiliate relationships where applicable.
The technical analysis as several aspects such as, ascending triangles, piercing lines, and many others. Notably, in crypto trading, technical analysis is crucial. It helps the investors make decisions regarding how much and when to enter the market. We have discussed several important patterns and indicators in the past. Today, we will be exploring the subset of triangles. Before that, let’s understand more about triangles.
When it comes to the study of technical analysis, triangles are considered continuation patterns. There are three different types of triangles, and it is crucial to fully comprehend each. These formations are symmetric triangles, ascending triangles, and descending triangles, in no particular order. Let’s understand more about ascending triangle patterns.
A triangle must have at least two swing highs and two swing lows for its trendlines to be valid.
A stop loss is typically positioned on the side opposite the breakout, just outside the pattern.
Technical analysis often makes use of ascending triangles as chart patterns. It is made possible by price movements where the swing highs and a rising trendline along the swing lows intersect to form a triangle. Triangle pattern breakouts are frequently sought after by traders. A breakout could happen either upward or downward.
A bullish ascending triangle is defined by a rising lower trendline and a flat supporting upper trendline. According to this pattern, buyers appear to be more aggressive than sellers as prices continue to reach higher lows. The pattern is finished when the price moves out of the triangle in the direction of the overall trend.
Ascending triangles are also known as continuation patterns because prices of the tokens frequently move in the same direction as the trend. This happens before the triangle formed. Due to the clear entry point, profit target, and stop-loss level it provides, an ascending triangle is a trading opportunity.
Once traders know what to look for, the ascending triangle is fairly simple to spot on cryptocurrency charts.
Read more: Bollinger Band: How To Trade With It In The Crypto Chart?
On a cryptocurrency chart, the illustration provides a flawless example of an ascending triangle. The 4-hour time frame chart for the ETH coin price displays an ascending triangle pattern. The neckline of this pattern is located between $4150 and 4100, which represents the main resistance that buyers must overcome in order to start an upward trend.
The risk/reward ratio of the indication initially exceeded patterns, but it gradually shrank. When a pattern gets smaller, the stop loss gets smaller too because it’s closer to the breakout point, but the profit target is still based on the biggest part of the pattern.
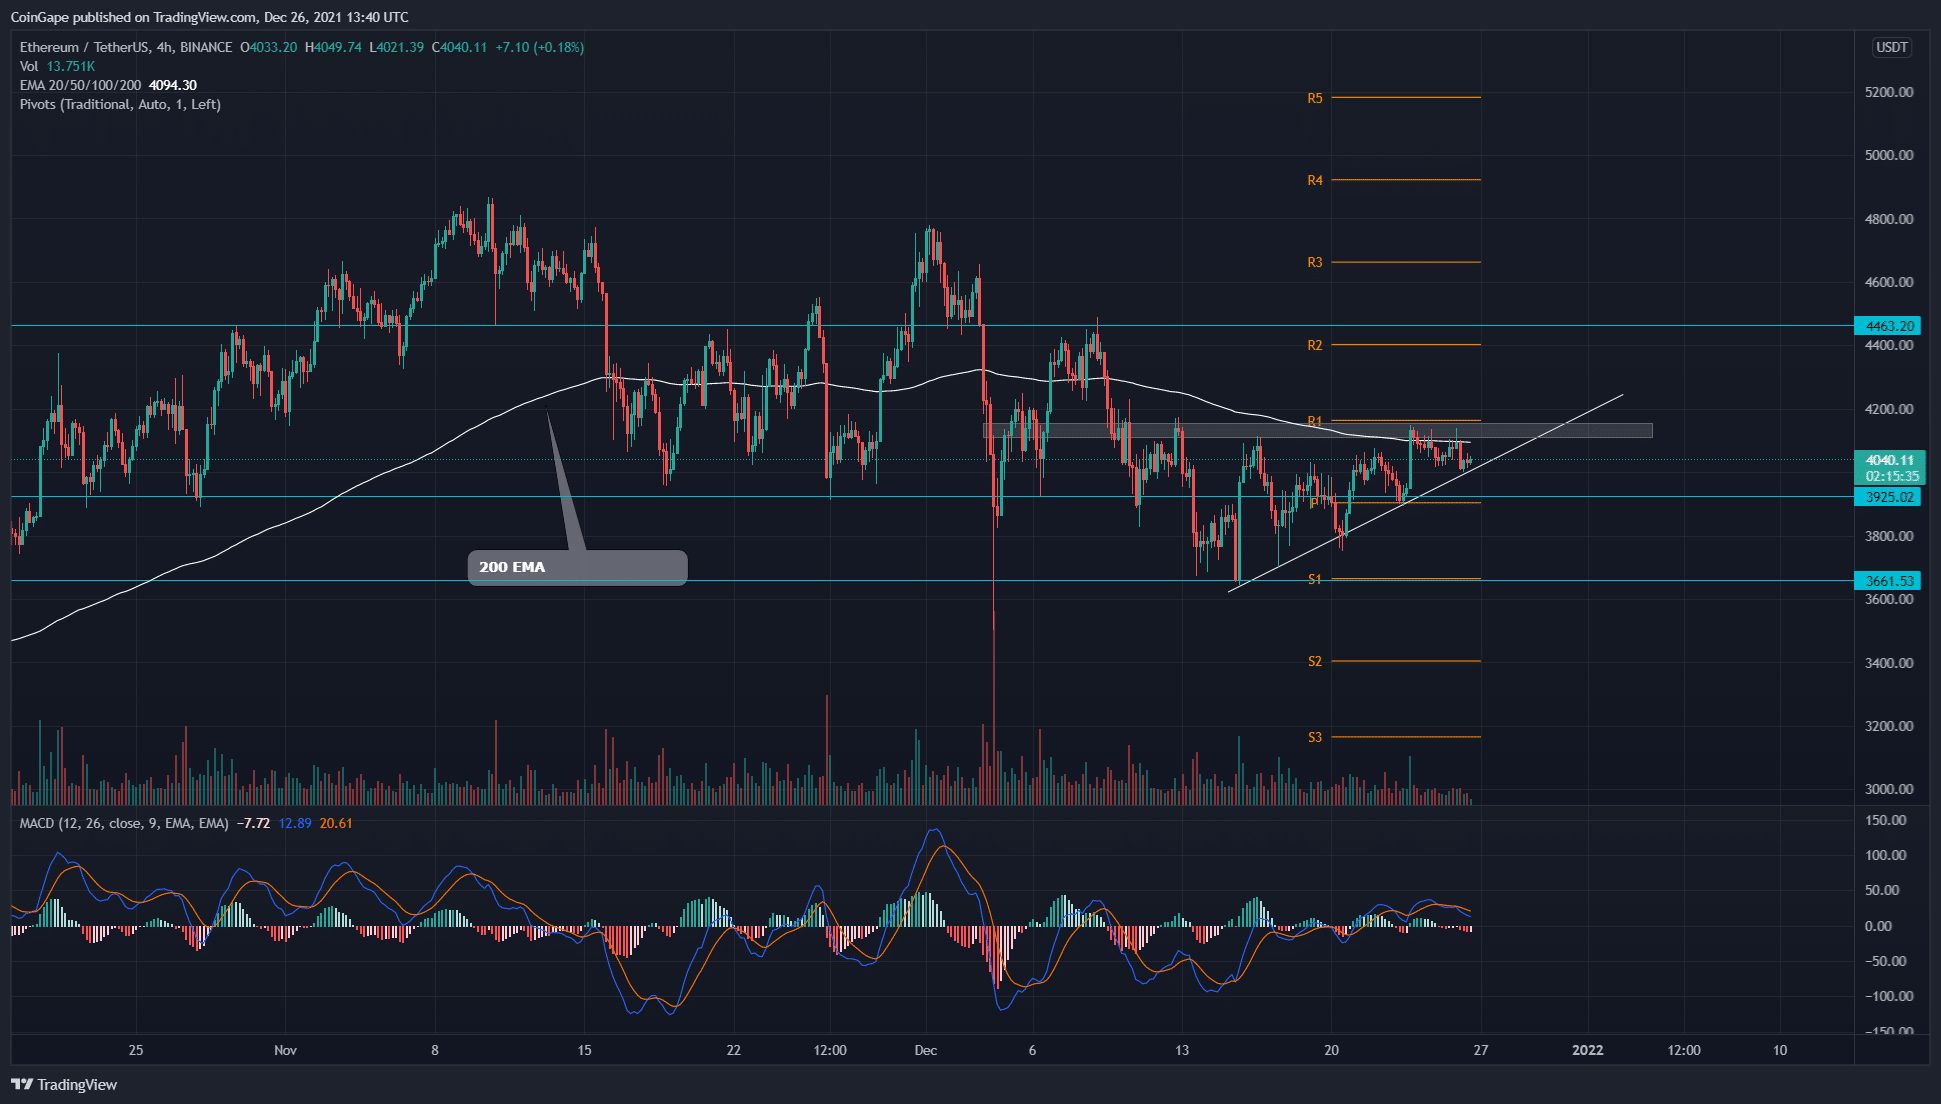
Trading the ascending triangle requires traders to be aware of the uptrend visible on the ETH chart. Then, as the cryptocurrency candlesticks start to consolidate, the ascending triangle appears. The measuring method can be applied once the triangle has formed because traders watch for the breakout.
After observing a convincing break above resistance, crypto traders can open a long position, placing a stop loss at the most recent swing low. With this action, they will be able to set their profit goals according to the measurement technique.
Consider the triangle’s lower line, or lower trendline, as the demand line that serves as support on the chart. The token’s price starts to rise at this point as buyers outnumber sellers of the issue. The supply line, which forms the triangle’s top line, stands in for the overbought side of the market when investors are selling their positions and taking their profits with them. However, smart traders always use multiple indicators to confirm the prediction of the coin.
Read more: What Is Margin Trading in Crypto And How to Benefit From It?


 50k+ Articles
 Buy $GGs