 Buy $GGs
ETH Price Analysis: Ethereum (ETH) Bulls Struggling To Fully Reclaim $200 As Sellers Battle To Push Lower


- Ethereum increased by 1.5% as the coin managed to reach the $199 level today.
- The cryptocurrency is back in the bullish zone after the RSI managed to rise above the 50 level.
Ethereum went on a small 1.5% price hike today as the coin increases to the $199 level. It had actually managed to surge as high as $206 today but has since dropped back beneath the $200 level to the current $199 level.
Despite the drop back beneath $200, the RSI has managed to climb back above the 50 line to signify that the bulls are back in control of the market momentum moving forward. We must still wait for a close above $200 to confirm that the buyers are willing to drive Ethereum higher.
Ethereum Price Analysis
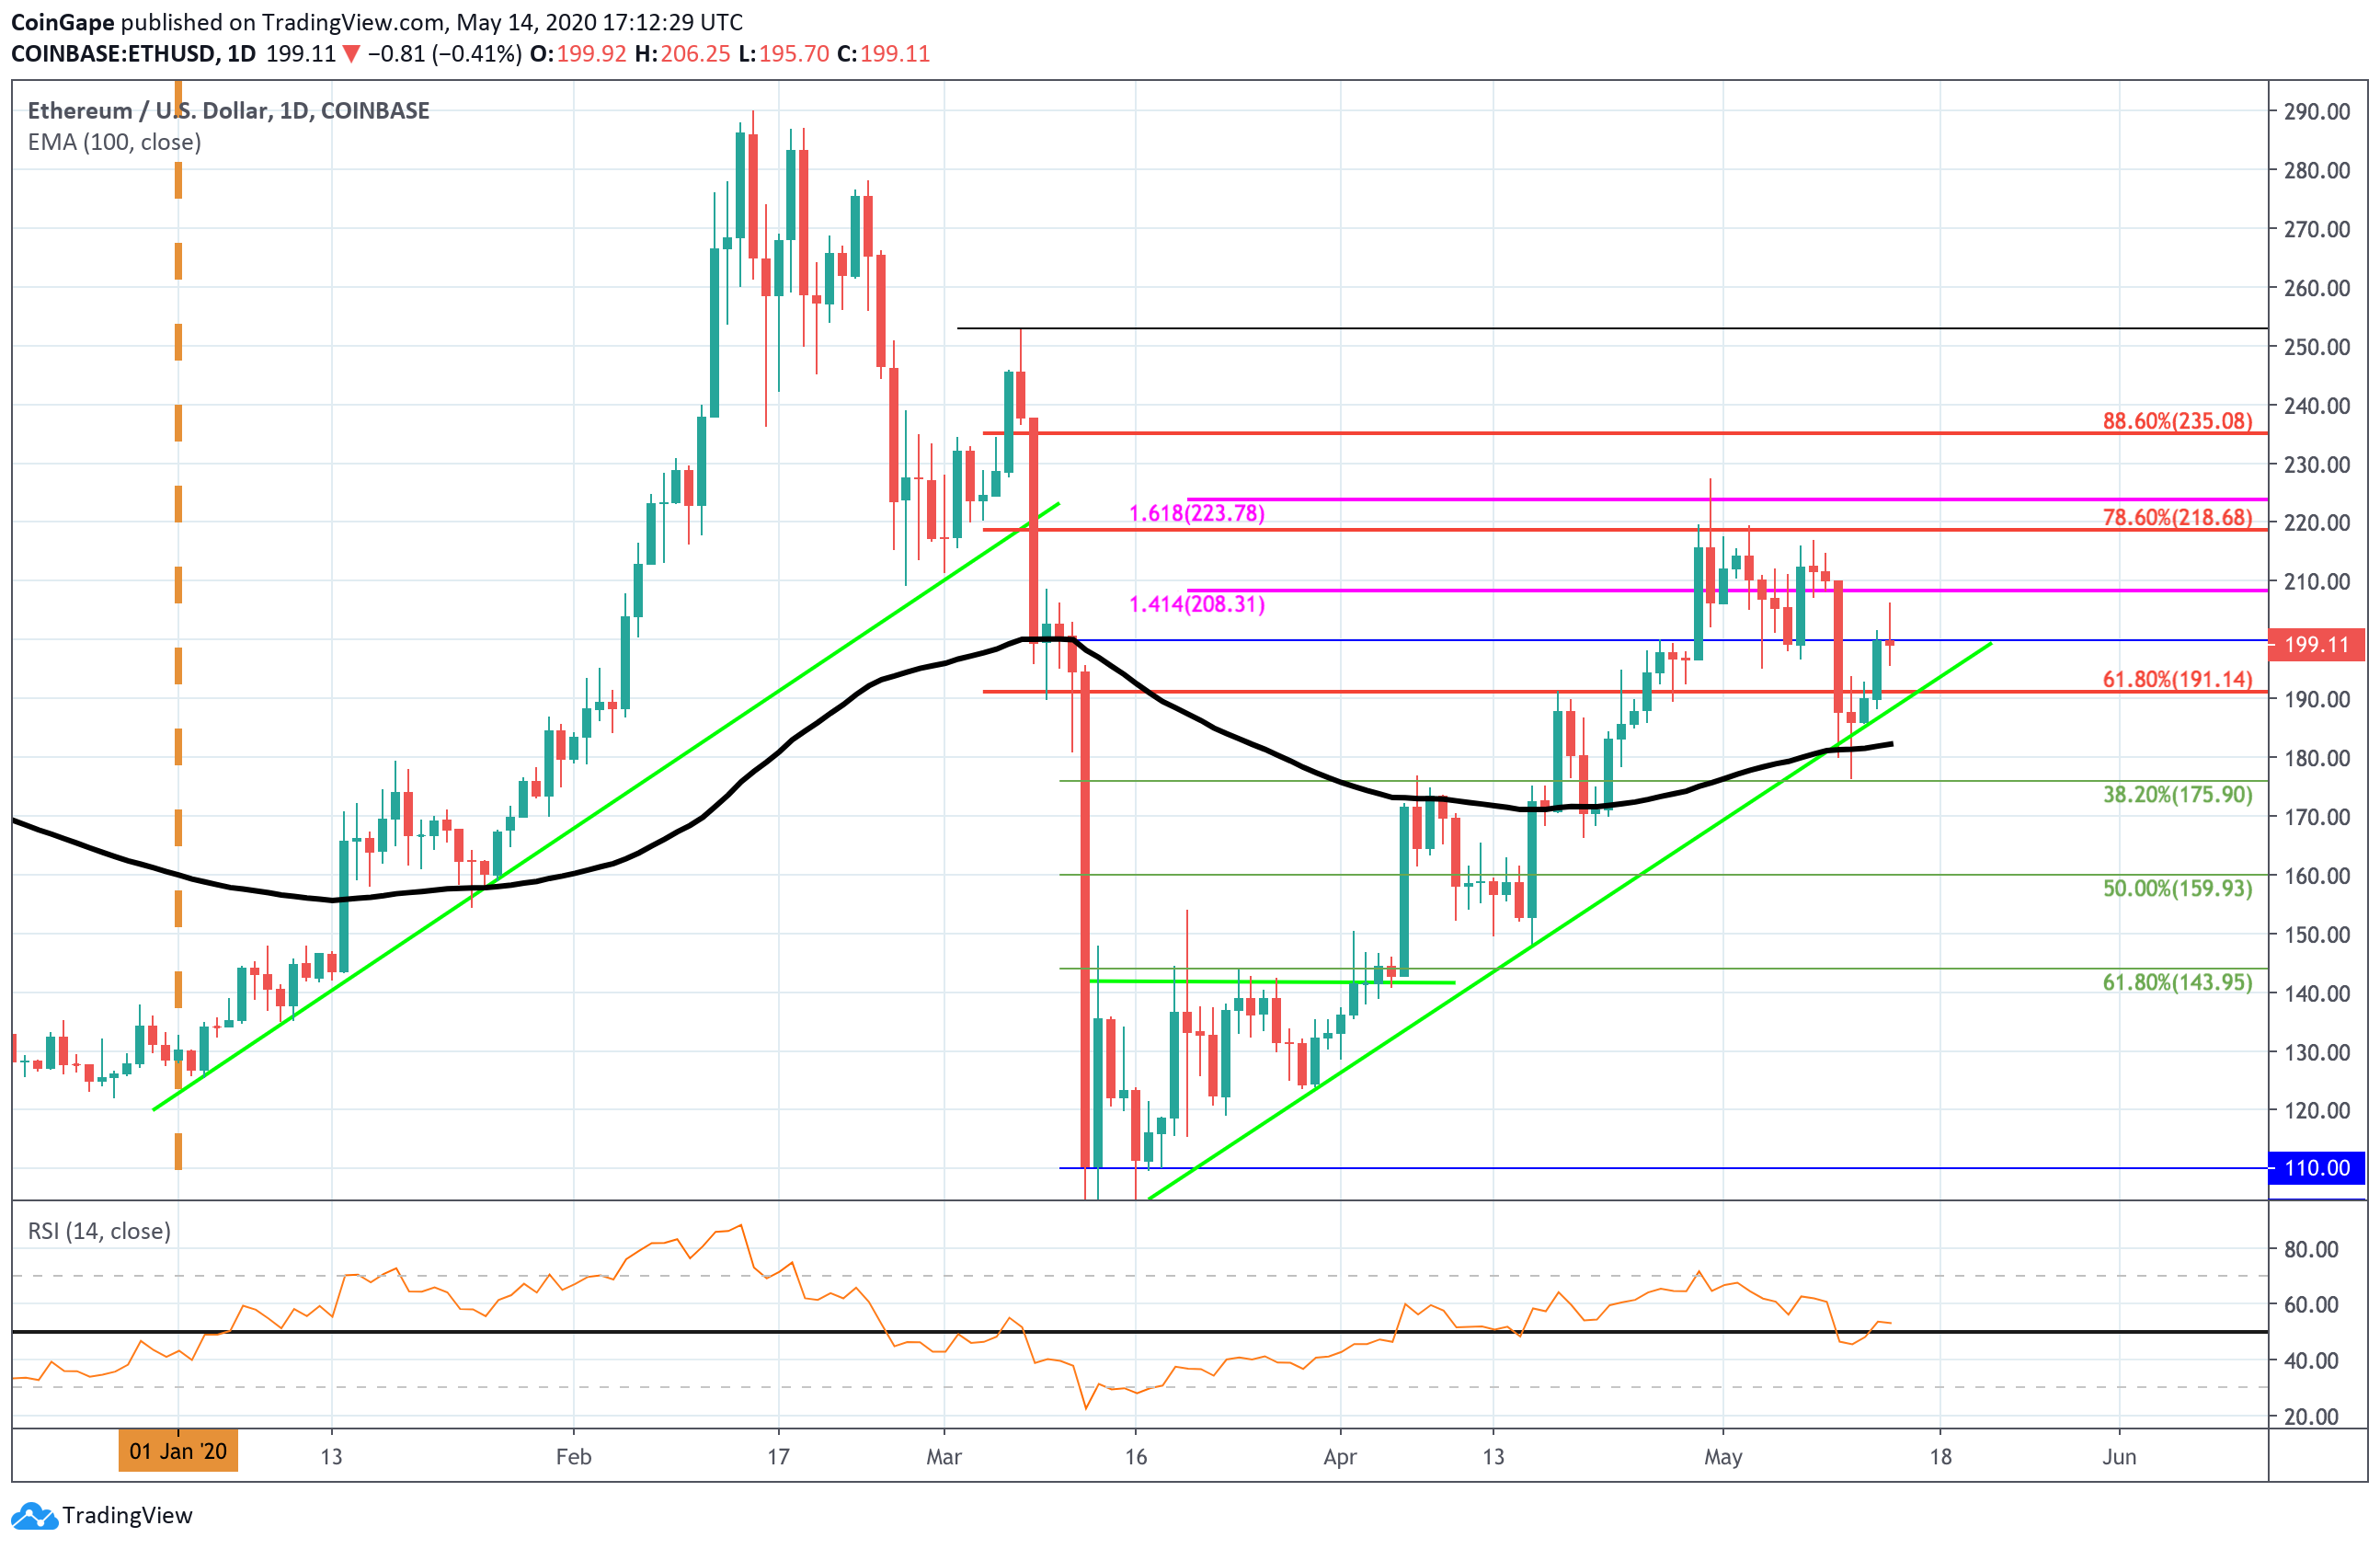
ETH/USD – Daily CHART – SHORT TERM
-
Market Overview
Looking at the daily chart above, we can see that Ethereum managed to rebound from the rising support trend line over the past few days. It had previously dropped from around $210 to fall as low as $180 over the weekend but the bounce at the rising trend line prevented the market from slipping into the bearish territory.
Today, Ethereum managed to push higher from $199 to reach as high as $206. However, it seems that the sellers have started to step back in as they pushed the market back beneath the $200 level.
-
Short term prediction: NEUTRAL
ETH still needs to cleanly close above $220 to turn bullish now and would have to drop beneath the support at $170 to turn bearish.
If the bulls continue to drive back above $200, the first level of resistance is located at 4208 (1.414 Fib Extension level). This is followed by resistance at $218 (bearish .786 Fib Retracement) $223 (1.618 Fib Extension), and $235 (bearish .886 Fib Retracement).
On the other side, if the sellers push lower, the first level of support lies at $191. This is followed by support at the rising trend line. Beneath the trend line, support is located at $180 (100-days EMA), and $175 (.382 Fib Retracement).
The RSI recently broke back above 50 to show that the buyers are attempting to regain control of the market momentum.
-
Key Levels
Support: $190, $180, $170, $160.
Resistance: $200, $208, $218, $223, $235.
Play 10,000+ Casino Games at BC Game with Ease
- Instant Deposits And Withdrawals
- Crypto Casino And Sports Betting
- Exclusive Bonuses And Rewards


Why Trust CoinGape
CoinGape has covered the cryptocurrency industry since 2017, aiming to provide informative insights Read more… to our readers. Our journal analysts bring years of experience in market analysis and blockchain technology to ensure factual accuracy and balanced reporting. By following our Editorial Policy, our writers verify every source, fact-check each story, rely on reputable sources, and attribute quotes and media correctly. We also follow a rigorous Review Methodology when evaluating exchanges and tools. From emerging blockchain projects and coin launches to industry events and technical developments, we cover all facets of the digital asset space with unwavering commitment to timely, relevant information.

Delivered every day.
- Insights that move markets
- 100,000 active subscribers
Related Articles


- “There Is Only One Gold,” Billionaire Ray Dalio Says Amid BTC’s Quantum Threats
- Goldman Sachs CEO Predicts ‘Weeks’ of Crypto Market Crash as U.S Iran War Continues
- Polymarket Axes ‘Nuclear Detonation’ Prediction Market Amid Public Fury
- Indiana Signs Bitcoin Bill Into Law Allowing Crypto in Retirement Plans
- ‘Time to Act Is Now’: CFTC Chief Pushes Swift Passage of CLARITY Act
- Bitcoin Price At Risk? Professor Who Predicted US-Iran War Says America Could Lose
- Gold Price Prediction March 2026: Rally, Crash, or Record Highs?
- RIOT Stock Prediction as Needham, Piper Sandler Slash Target After Earnings
- Cardano Price Outlook As Charles Hoskinson Warns Over CLARITY Act
- Circle Stock Price Climbs 15% to $96, Can Rally Continue in March 2026?
- Bitcoin Price Prediction as US-Iran War Enters 4th Consecutive Day


