 Buy $GGs
Ethereum Price Analysis: ETH Bulls Back On Offensive As They Target $200


- Ethereum increased by 2.5% today as it reaches the $195 level.
- The cryptocurrency managed to rebound at the rising support trend line.
Ethereum increased by a total of 2.5% today as the cryptocurrency managed to reach the $195 level. The coin had previously been falling as it dropped from above $200 to reach the $175 support level. There was a combined level of support at $180 provided by the rising trend line and the 100-days EMA which allowed Ethereum to rebound higher.
This rebound now puts the bulls back in the driving seat as they attempt to reclaim the $200 threshold.
Ethereum Price Analysis
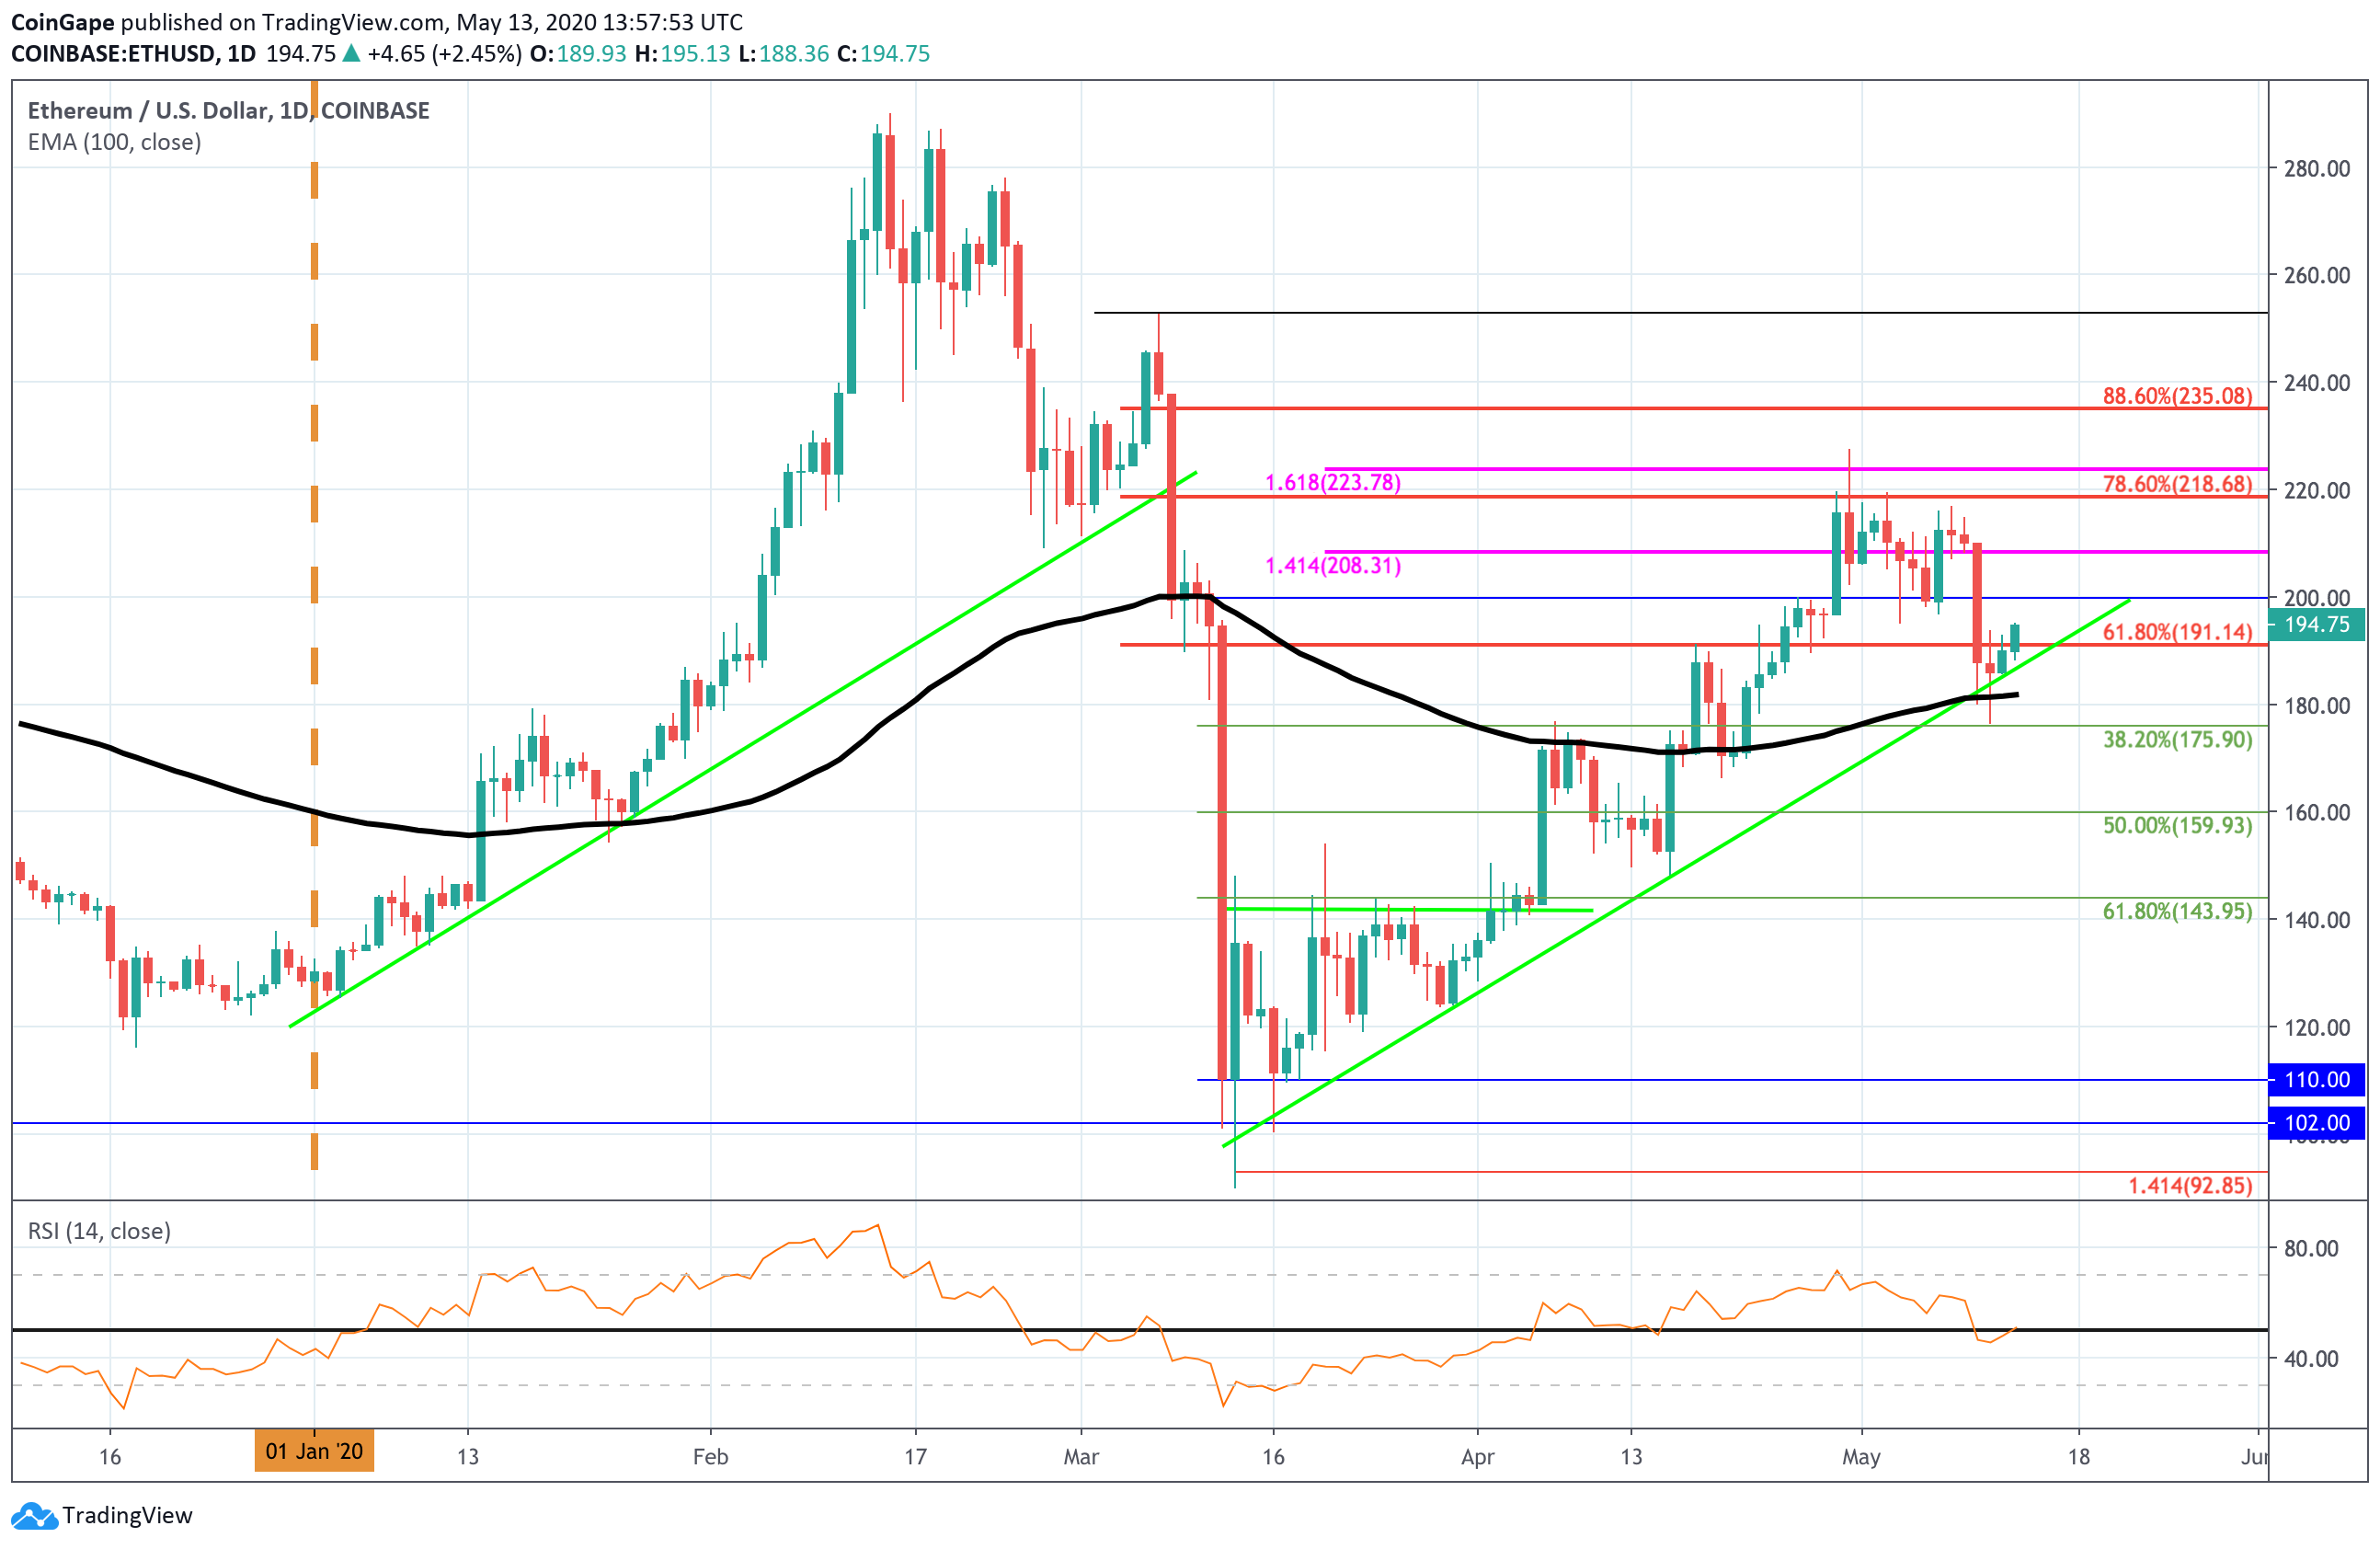
ETH/USD – Daily CHART – SHORT TERM
Market Overview
Looking at the daily chart above, we can see that ETH dropped from $210 over the weekend as it slipped beneath $200 and landed at the 100-days EMA at around $180. It briefly dropped further beneath this but managed to find support at the $176 level, provided by the .382 Fib Retracement.
We can see that ETH managed to remain above the rising trend line during this drop and it rebounded from here yesterday, preventing the market from dropping into a bearish short term trend.
Short term prediction: NEUTRAL
As ETH is still beneath $200, we can consider the market as neutral right now. The coin would still need to rise higher and break above the resistance at $220 to turn bullish. A closing candle beneath $175 would put Etheruem in danger of turning bearish in the short term,
If the buyers continue to drive ETH higher, the first level of resistance is located at $200. Above $200, resistance is expected at $206 (1.414 Fib Extension), $218 (bearish .786 Fib Retracement), and $224 (1.618 FIb Extension).
Above this, added resistance lies at $235 (bearish .886 Fib Retracement), $240, and $250.
Toward the downside, the first level of support lies at the rising trend line. Beneath the trend line, support is found at the 100-days EMA at $180, $176 (.382 Fib Retracement), and $160 (.5 Fib Retracement).
Key Levels
Support: $180, $170, $160, $155, $150, $145, $140, $135.
Resistance: $200, $208, $218, $223, $235, $240, $250, $260, $280.
Play 10,000+ Casino Games at BC Game with Ease
- Instant Deposits And Withdrawals
- Crypto Casino And Sports Betting
- Exclusive Bonuses And Rewards


Why Trust CoinGape
CoinGape has covered the cryptocurrency industry since 2017, aiming to provide informative insights Read more… to our readers. Our journal analysts bring years of experience in market analysis and blockchain technology to ensure factual accuracy and balanced reporting. By following our Editorial Policy, our writers verify every source, fact-check each story, rely on reputable sources, and attribute quotes and media correctly. We also follow a rigorous Review Methodology when evaluating exchanges and tools. From emerging blockchain projects and coin launches to industry events and technical developments, we cover all facets of the digital asset space with unwavering commitment to timely, relevant information.

Delivered every day.
- Insights that move markets
- 100,000 active subscribers
Related Articles


- Kraken Gains Access To The Federal Reserve’s Payment System as Ripple Awaits Approval
- “There Is Only One Gold,” Billionaire Ray Dalio Says Amid BTC’s Quantum Threats
- Goldman Sachs CEO Predicts ‘Weeks’ of Crypto Market Crash as U.S Iran War Continues
- Polymarket Axes ‘Nuclear Detonation’ Prediction Market Amid Public Fury
- Indiana Signs Bitcoin Bill Into Law Allowing Crypto in Retirement Plans
- Robinhood Stock Price Prediction As Cathie Wood Buys $12M Dip in Bold ARK Move
- Bitcoin Price At Risk? Professor Who Predicted US-Iran War Says America Could Lose
- Gold Price Prediction March 2026: Rally, Crash, or Record Highs?
- RIOT Stock Prediction as Needham, Piper Sandler Slash Target After Earnings
- Cardano Price Outlook As Charles Hoskinson Warns Over CLARITY Act
- Circle Stock Price Climbs 15% to $96, Can Rally Continue in March 2026?


