Ethereum, Harmony and Spell Token Price Analysis: 07 December


Following the crash on December 4, Ethereum has risen to trade above the $4000 level again. At press time, the coin was trading for $4357.43. The alt-king propelled above the $4272.77 mark and could attempt to trade near the resistance mark of $4540.97, Ethereum’s additional resistance stood at its multi-week high of $4865.31. Over the last 24 hours, the coin registered a 6.2% increase in value. The trading volume of Ethereum also crept up over the last day.
Ethereum Price Analysis
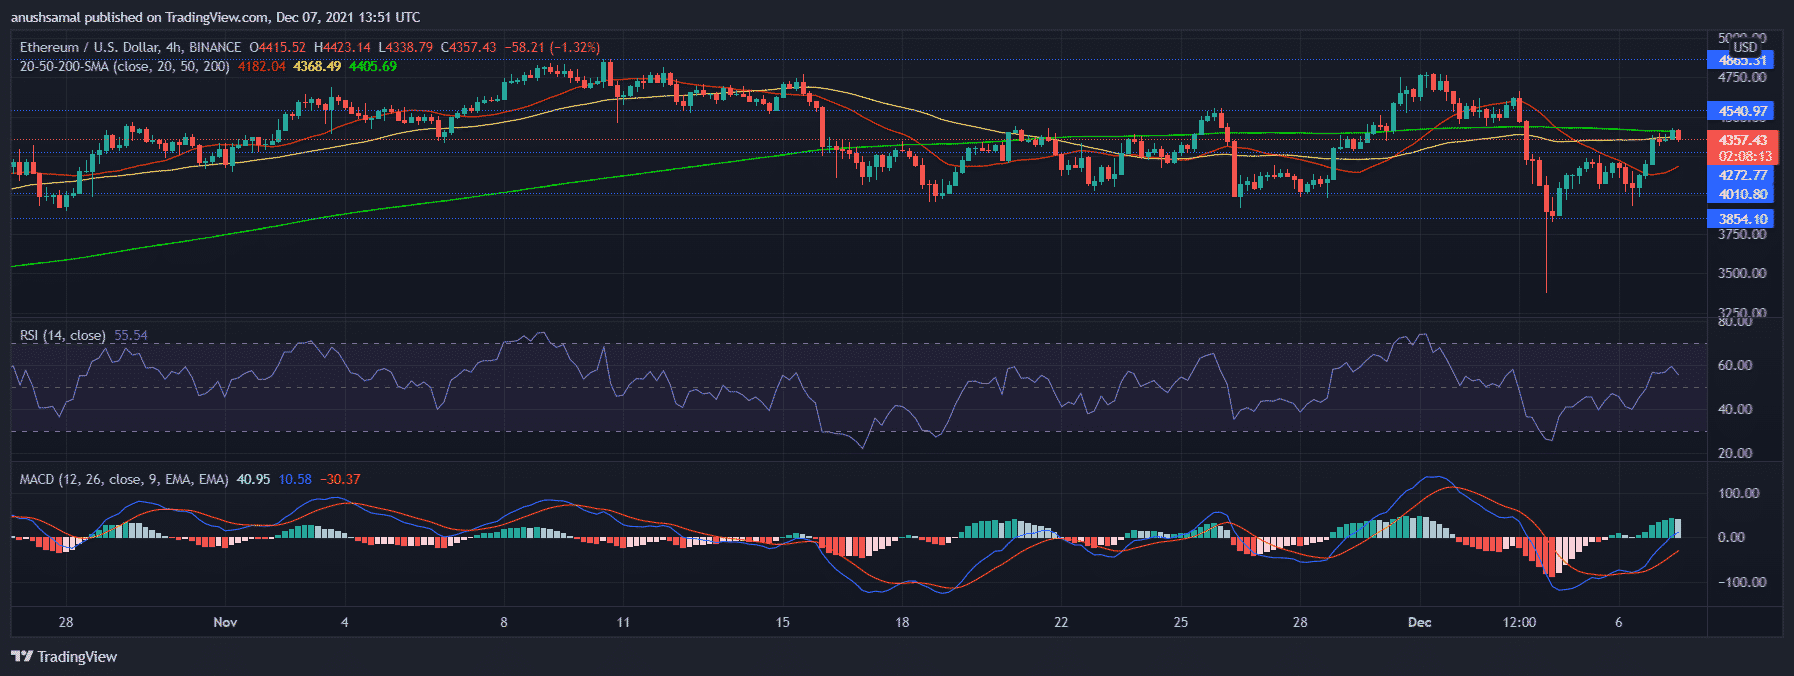
Ethereum’s technicals portrayed a bullish outlook, the coin’s price was seen above the 20-SMA line which indicated that price momentum was still controlled by the buyers in the market.
MACD signalled a bullish crossover and displayed green histograms. The Relative Strength Index was above the half-line in correspondence to the 20-SMA line, although the indicator flashed a downtick, this signalled a possible dip in prices over the upcoming trading sessions.
In case of a price reversal, the support region for Ethereum awaits at $4010.80 and then at $3854.10.
Harmony Price Analysis
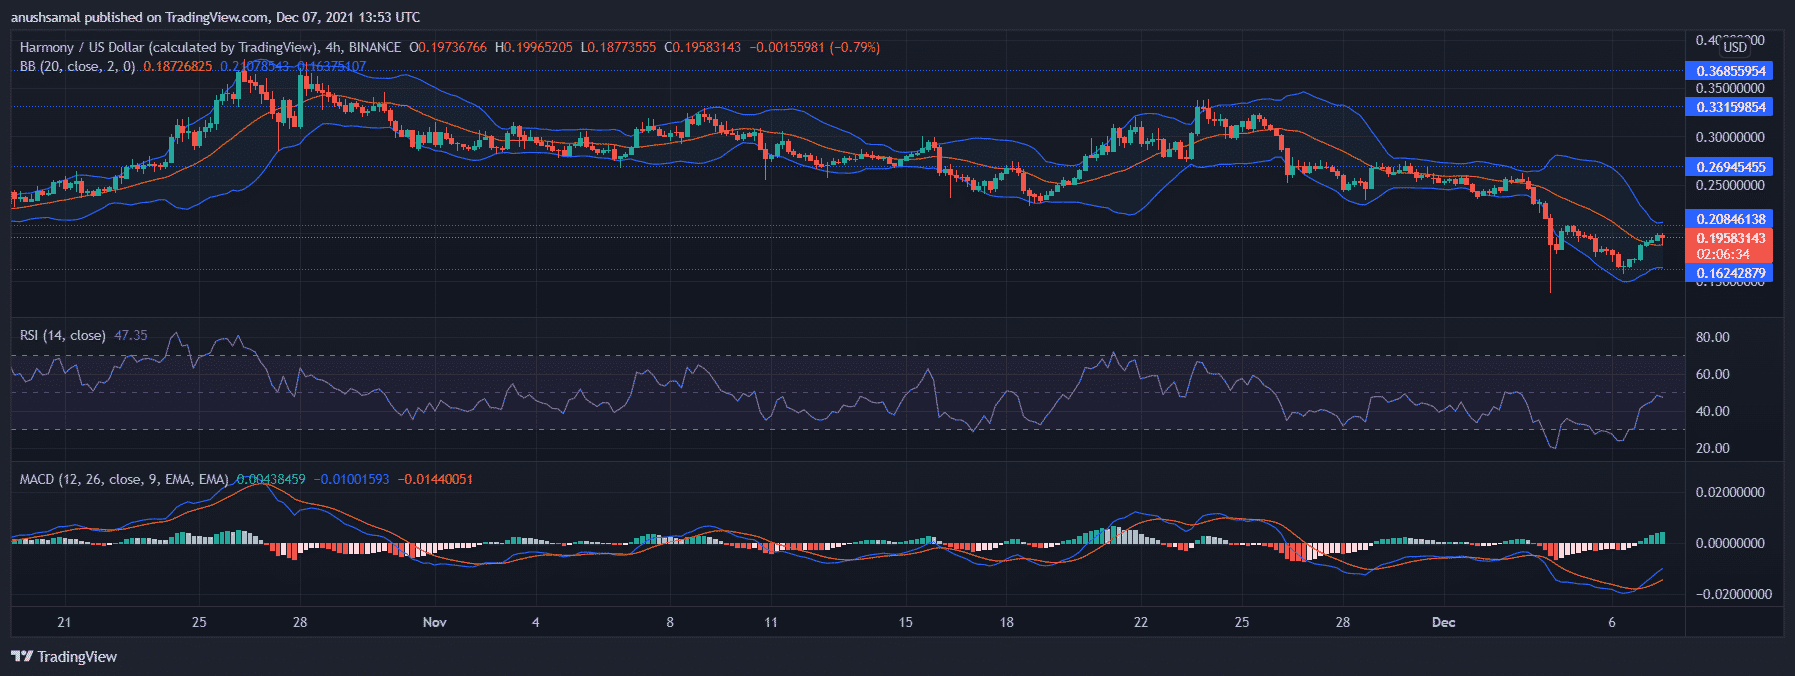
Harmony was priced at $0.195 after it surged 16% over the last 24 hours. Harmony was among the top gainers that showed double-digit appreciation. Over the past 72 hours, the token displayed a steady recovery, however, in the last 24 hours the prices have seen a considerable increase. The technical outlook was also positive at the time of writing.
Buying pressure as indicated on the Relative Strength Index also showed a surge, the token also recorded a hike in the trading volume over the past day.
MACD’s bullish crossover agreed with the bullish price action. A continuous upward push will cause Harmony to encounter resistance at $0.208 and then at $0.269, a level that bulls have not gotten past in the last few days. Additional price ceilings awaited the coin at $0.334 and at $0.368, a level the coin last touched in October.
Bollinger Bands displayed constriction, however, it also flashed a little relaxation which is usually indicative of volatile price action.
On the flip side, the major support level was at $0.162.
Spell Token Price Analysis
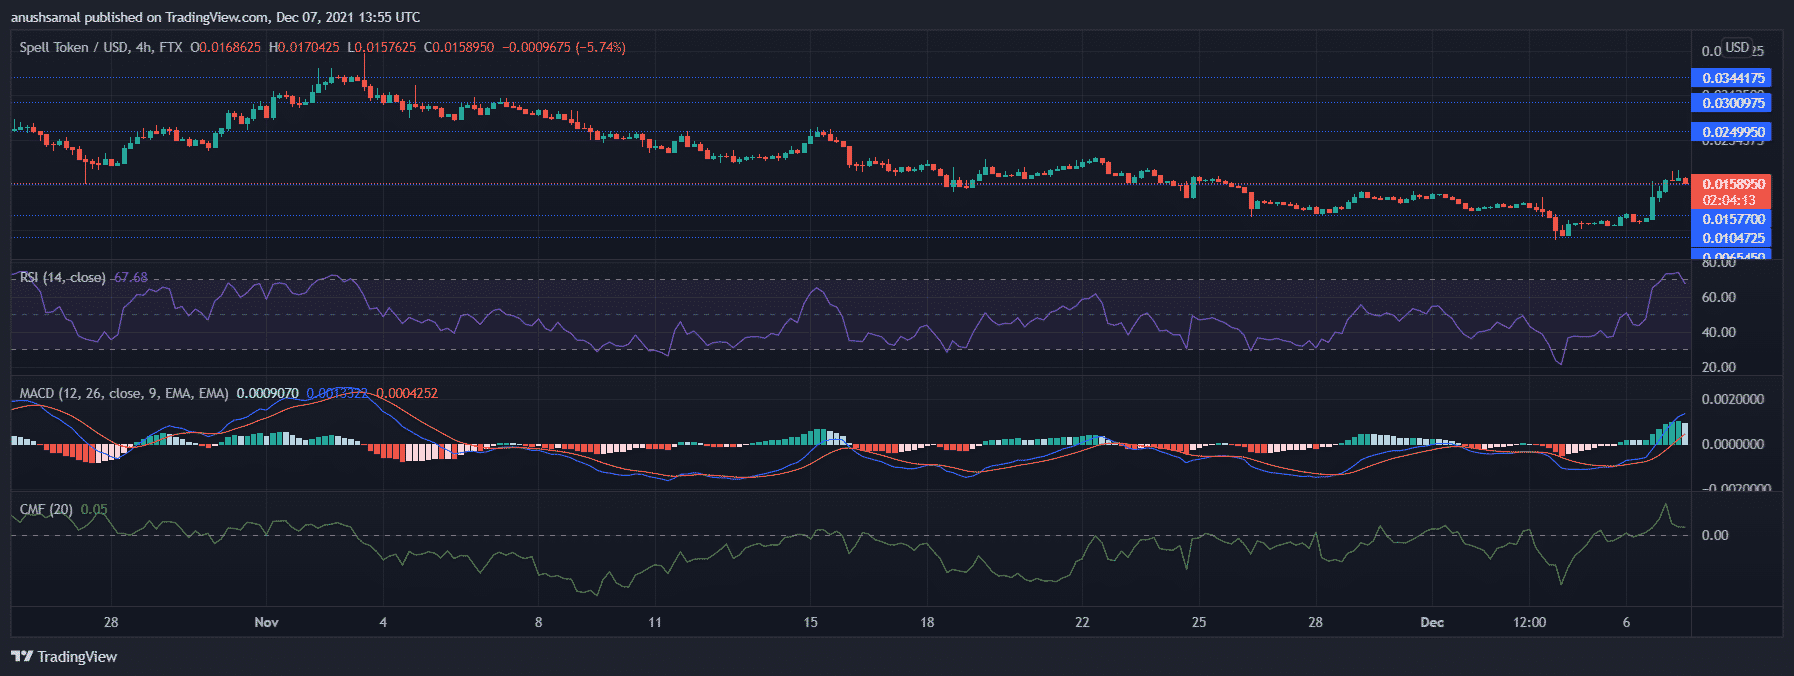
Spell Token surged by a massive 60.9% over the last 24 hours, it is the native token of Abracadabra.money DeFi protocol. The token depicted an enormous growth in its trading volume by 97.83% over the last 24 hours. Major technicals have pointed towards a massive bull price action.
Relative Strength Index in the last 24 hours revisited its monthly high which is indicative of a growth in the number of buyers in the market. MACD also underwent a bullish crossover.
Capital inflows were in surplus as seen on the Chaikin Money Flow, which also was the monthly high for the token.
The tremendous surge in prices could be a consequence of the increase in the growth of decentralized stable coins. Abracadabra.money is powered by the SPELL Token which is a stable coin, the total value locked of which has been increasing along with its circulating supply.

Why Trust CoinGape
CoinGape has covered the cryptocurrency industry since 2017, aiming to provide informative insights Read more… to our readers. Our journal analysts bring years of experience in market analysis and blockchain technology to ensure factual accuracy and balanced reporting. By following our Editorial Policy, our writers verify every source, fact-check each story, rely on reputable sources, and attribute quotes and media correctly. We also follow a rigorous Review Methodology when evaluating exchanges and tools. From emerging blockchain projects and coin launches to industry events and technical developments, we cover all facets of the digital asset space with unwavering commitment to timely, relevant information.

Delivered every day.
- Insights that move markets
- 100,000 active subscribers
Related Articles

- Breaking: U.S. Supreme Court Strikes Down Trump Tariffs, BTC Price Rises
- Breaking: U.S. PCE Inflation Rises To 2.9% YoY, Bitcoin Falls
- BlackRock Signals $270M Bitcoin, Ethereum Sell-Off as $2.4B in Crypto Options Expire
- XRP News: Dubai Tokenized Properties Trading Goes Live on XRPL as Ctrl Alt Advances Project
- Aave Crosses $1B in RWAs as Capital Rotates From DeFi to Tokenized Assets
- Ethereum Price Rises After SCOTUS Ruling: Here’s Why a Drop to $1,500 is Possible
- Will Pi Network Price See a Surge After the Mainnet Launch Anniversary?
- Bitcoin and XRP Price Prediction As White House Sets March 1st Deadline to Advance Clarity Act
- Top 3 Price Predictions Feb 2026 for Solana, Bitcoin, Pi Network as Odds of Trump Attacking Iran Rise
- Cardano Price Prediction Feb 2026 as Coinbase Accepts ADA as Loan Collateral
- Ripple Prediction: Will Arizona XRP Reserve Boost Price?


