 Buy $GGs
Ethereum Price Rally Awaits This Bullish Pattern Confirmation


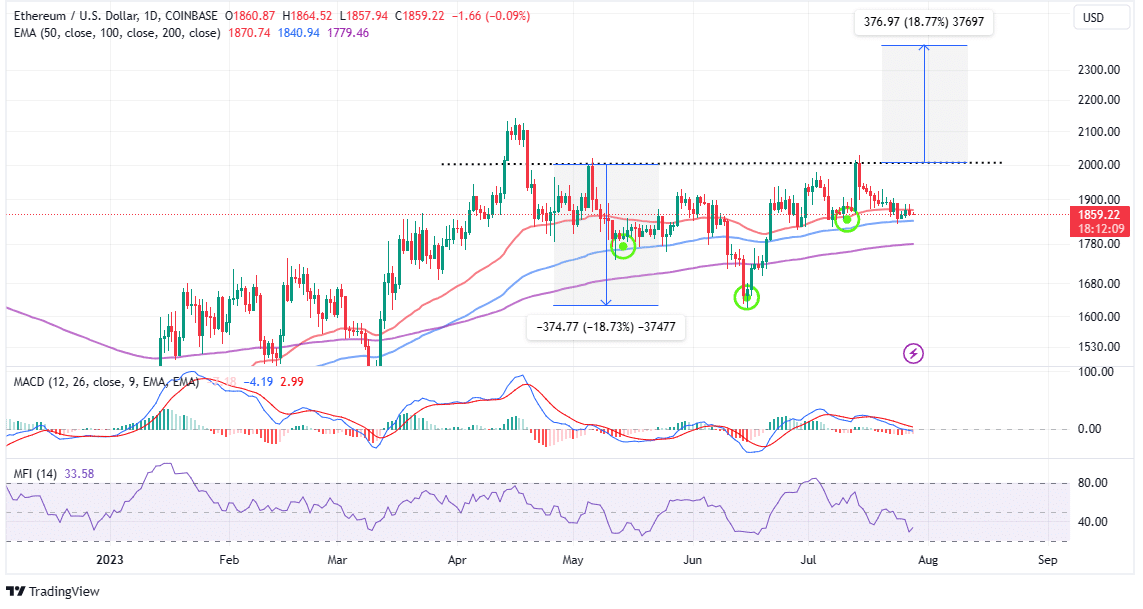
Ethereum price has steadied above $1,800 for nearly two months and traded at $1,864 on Friday. On the upside, price action has been capped under $2,000, amid a general slump in the trading volume.
Following the Ripple ruling in early July, investors focused less on Bitcoin (BTC) and Ethereum, favoring other leading altcoins like XRP, Cardano (ADA), Polygon (MATIC), Solana (SOL), and most recently Dogecoin (DOGE).
The biggest task among Ethereum is holding the price above $1,800 – a move likely to prevent possible declines to $1,700 and $1,600.
If a recovery ensues from the current market value, the token powering the largest smart contracts token might trigger a surge in investor interest, who are still waiting on the sideline for an uptrend confirmation above $2,000.
Here’s What It Will Take Ethereum to Rally?
Ethereum price is in the middle of nurturing a potentially massive breakout that could propel it not only above $2,000 but allow bulls to close the gap to $2,400 for the first time since May 2022.
The daily chart shows the formation of an inverse head-and-shoulders (H&S) pattern, promising a 19% bullish move to $2,385.
The inverse H&S pattern shows a downtrend ending and an uptrend starting. It has three lows: the middle one is the lowest (head) and the outer ones are higher (shoulders).
This pattern is validated when the price breaks above a line joining the highs of the shoulders (neckline), located around $2,000 for Ethereum price.
Traders are always advised to buy when this happens or wait for a pullback to the neckline to be certain that the breakout is sustainable and not a bull trap. Note that the price target is the distance from the head to the neckline (19%) added to the breakout point.
Other indicators must be consulted when trading the H&S, especially the Money Flow Index (MFI), which monitors the inflow and outflow of funds in Ethereum markets. That said, the MFI as presented on the daily chart, has a bullish outlook, which implies that a breakout is in the offing.
Evaluating the Bullish Case in Ethereum Price
Adding credence to the bullish outlook on the daily chart is the Moving Average Convergence Divergence (MACD) indicator – likely to send a buy signal over the weekend.
Traders seeking fresh exposure to ETH long positions should be on the lookout for bullish crosses in the momentum indicator, marked by the MACD line in blue crossing below the signal line in red.
To be on the safe side, Ethereum price must break and hold above the immediate hurdle, as highlighted by the 50-day Moving Average (EMA) at $1,870. Profit booking can start at $2,000 but extremely bullish traders may want to hold on for the H&S pattern breakout to $2,385.
Related Articles
Play 10,000+ Casino Games at BC Game with Ease
- Instant Deposits And Withdrawals
- Crypto Casino And Sports Betting
- Exclusive Bonuses And Rewards


Why Trust CoinGape
CoinGape has covered the cryptocurrency industry since 2017, aiming to provide informative insights Read more… to our readers. Our journal analysts bring years of experience in market analysis and blockchain technology to ensure factual accuracy and balanced reporting. By following our Editorial Policy, our writers verify every source, fact-check each story, rely on reputable sources, and attribute quotes and media correctly. We also follow a rigorous Review Methodology when evaluating exchanges and tools. From emerging blockchain projects and coin launches to industry events and technical developments, we cover all facets of the digital asset space with unwavering commitment to timely, relevant information.

Delivered every day.
- Insights that move markets
- 100,000 active subscribers
Related Articles


- Cardano’s DeFi TVL Climbs as USDCx Stablecoin Launches on Network
- Gold vs. Bitcoin: Can Gold Outperform BTC Amid US–Iran Conflict?
- Bitcoin Faces $1.8B in Panic Selling as U.S.-Iran Airstrikes Escalate; Will BTC Crash Below $60k?
- Gold ETF vs Tokenized Gold: Who Could Outperform in 2026?
- Crypto Weekly Wrap: Jane Street Targeted After Terra Suit, Vitalik’s ETH Selloffs, Regulatory Progress Feb 23-27
- Top Analyst Predicts Pi Network Price Bottom, Flags Key Catalysts
- Will Ethereum Price Hold $1,900 Level After Five Weeks of $563M ETF Selling?
- Top 2 Price Predictions Ethereum and Solana Ahead of March 1 Clarity Act Stablecoin Deadline
- Pi Network Price Prediction Ahead of Protocol Upgrades Deadline on March 1
- XRP Price Outlook As Jane Street Lawsuit Sparks Shift in Morning Sell-Off Trend
- Dogecoin, Cardano, and Chainlink Price Prediction As Crypto Market Rebounds


