 Buy Presale
ETHUSDT Analysis: ETH Price Action Parabola – Swing High Objective for a Strong Continuation


ETH price, maintaining its consecutive Higher Lows in a Price Action Parabola, no valid Volume Climax’s are present which is indicative of further upside potential. Price Action as of now has a greater probability of testing this recent S/R Flip Zone, allowing for long biased entries.
- Bullish Order Block Respected
- Weekly S/R Flip Confirmation
- Swing High Clear Objective
- RSI Bullish Control Zone
ETHUSDT Price Action Chart

Preluding to the chart above, Price Action is in a clear strong Bullish Volatility Expansion with successive Higher Highs and Higher Lows being established. This is indicative of a strong bull trend that is backed with bullish volume impulses, evident on the Volume Profile. The initial Order Block was back tested, confirming an S/R Flip Retest that led straight into the All-Time High region.
Price Action failed to break its All- Time high on three consecutive attempts, each rejection lead to a Higher Low, again proving resilience in Ethereum at the time. On the fourth attempt, a Bullish Engulfing candle successfully broke the resistance that led a strong impulse towards a new high.
As of current, Price Action is still trading in discovery with an established Swing High being set as the current objective. Taking this level out with increasing volume will greatly increase the probability of continuing this current Parabola. Higher targets will be associated such as the key Psychological $2000 level.
ETHUSDT Daily RSI
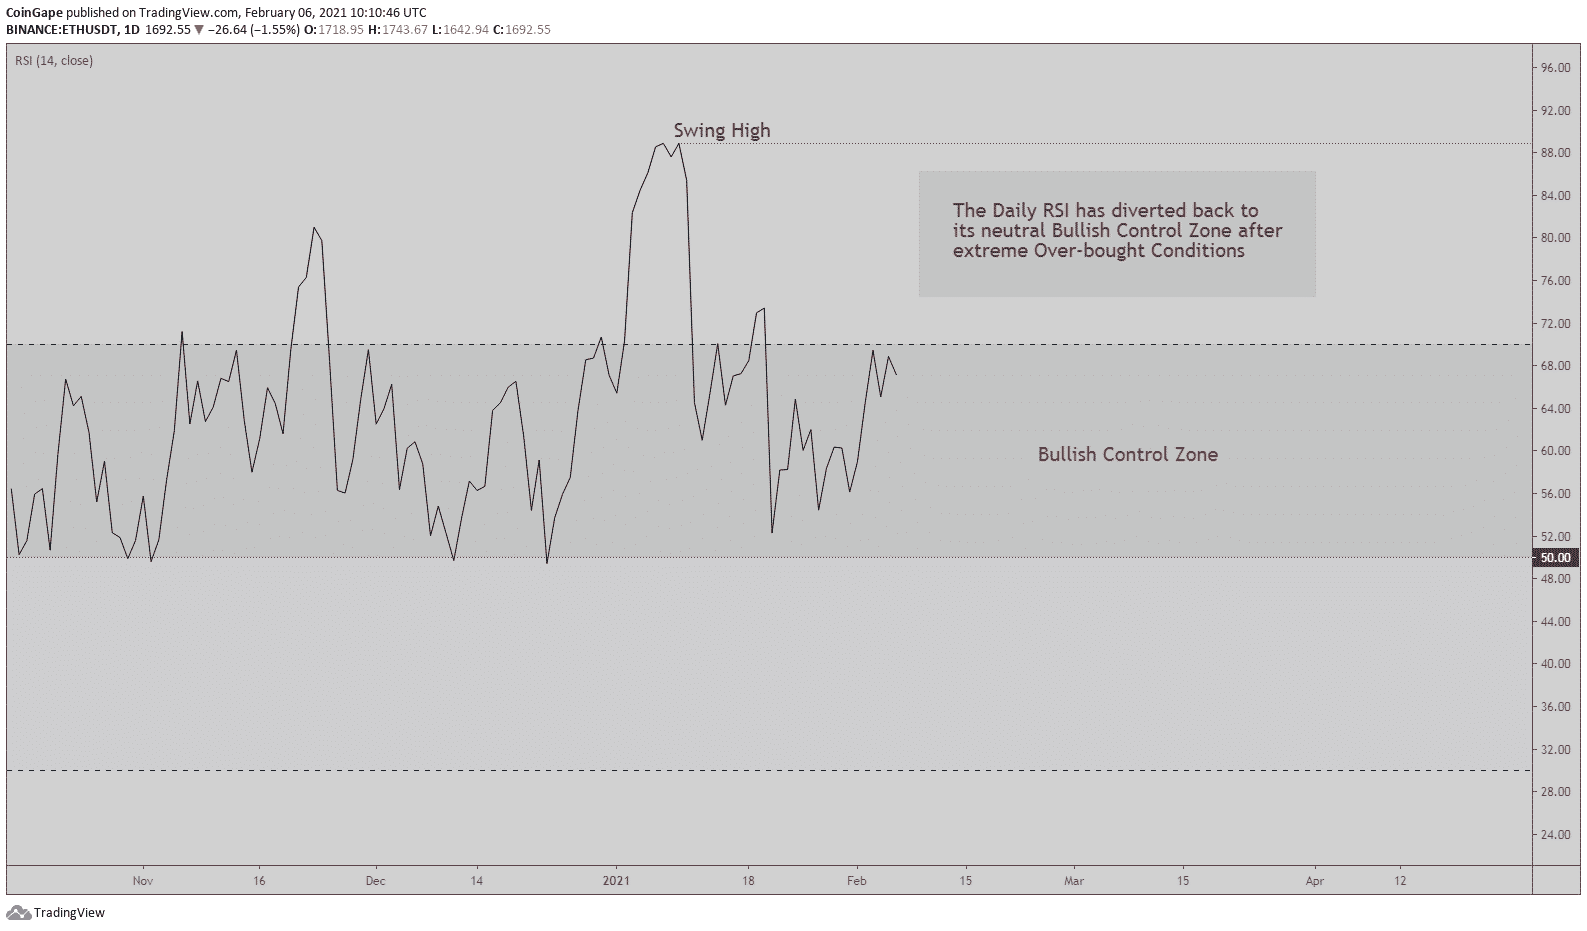
Observing the present RSI, we can see a healthy deviation back into its Bullish Control Zone from Overbought Conditions. This has reset the RSI into more of a neutral zone where holding these regions is deemed highly bullish. Penetrating the lower Bearish Control Zone will signal a potential correction for Ethereum as this has not occurred through the entire Bull Run.
To conclude, ETHEREUM remains highly bullish with the immediate objective being the Swing High. Price Action is trading in a clear Parabola that has not topped as there are no signs of a valid Volume Climax. The RSI is signaling strength as long as the current region is held; the probabilities are greater for further upside.
Hope this article helps in making discretionary trading decisions.
Play 10,000+ Casino Games at BC Game with Ease
- Instant Deposits And Withdrawals
- Crypto Casino And Sports Betting
- Exclusive Bonuses And Rewards


Why Trust CoinGape
CoinGape has covered the cryptocurrency industry since 2017, aiming to provide informative insights Read more… to our readers. Our journal analysts bring years of experience in market analysis and blockchain technology to ensure factual accuracy and balanced reporting. By following our Editorial Policy, our writers verify every source, fact-check each story, rely on reputable sources, and attribute quotes and media correctly. We also follow a rigorous Review Methodology when evaluating exchanges and tools. From emerging blockchain projects and coin launches to industry events and technical developments, we cover all facets of the digital asset space with unwavering commitment to timely, relevant information.

Delivered every day.
- Insights that move markets
- 100,000 active subscribers
Related Articles


- Prediction Market News: Kalshi Fines MrBeast Associate Over Insider Trading Amid State Crackdown
- CLARITY Act: Banks, Crypto Yet To Agree On New Crypto Bill Draft As March 1 Deadline Looms
- Michael Saylor Predicts $50T From Bonds Could Flow Into Bitcoin Ecosystem as Digital Credit Evolves
- Bitcoin Treasury Firm GD Culture Authorizes Sale of 7,500 BTC as Expert Warns Of More ‘Pain’
- USDT And USAT Get Adoption Boost as Tether Invests in Whop for Faster Settlements
- Will Solana Price Rally to $100 If Bitcoin Reclaims $72K?
- XRP Price Eye $2 Rebound as On-Chain Data Signals Massive Whale Accumulation
- Ethereum Price Reclaims $2K- New Rally Ahead or a Temporary Bounce?
- COIN Stock Price Prediction as Wall Street Pros Forecast a 62% Surge
- Cardano Price Signals Rebound as Whales Accumulate 819M ADA
- Sui Price Eyes Recovery as Third Spot SUI ETF Debuts on Nasdaq


