FTT Price Analysis: Can FTX Token Outperform BNB Coin? Bullish Divergence Patterns on HTF Hint Rise In Demand


FTT, the native token of the FTX crypto exchange is seeing a stable rise in demand against the Greenback and recovery from a decline against Bitcoin BTC. In this post, we analyze the FTT paired against the number one crypto-asset Bitcoin, and the USDT.
We’ll identify the significant support, resistance levels and identify chart patterns that suggest trend reversal and continuation on both the FTTBTC and FTTUSDT.
Let’s dive into it.
FTT Price Analysis: FTTBTC Daily Chart
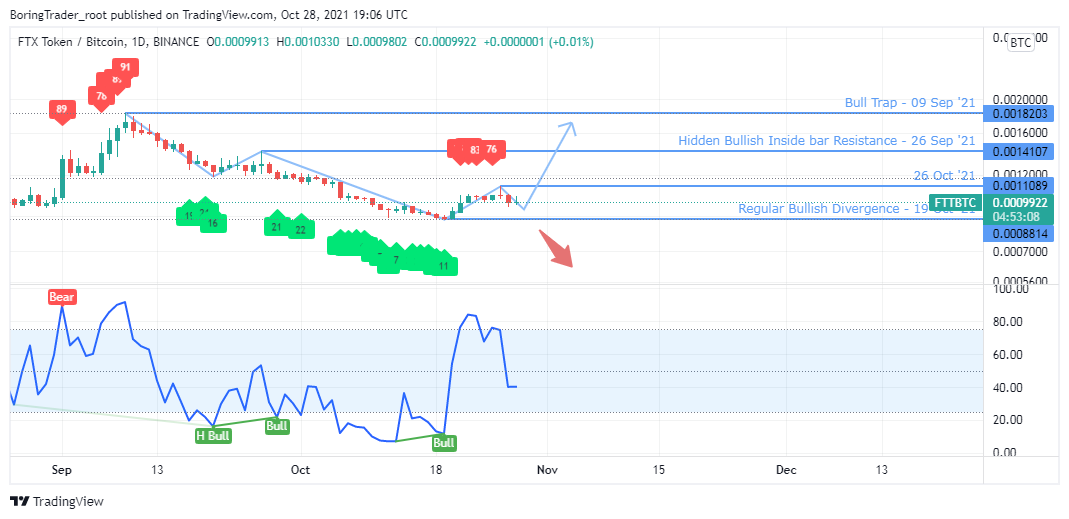
The FTTBTC chart above shows a 50% price slump following a bull-trap candlestick pattern on 09 September ’21. Bearish momentum found a price floor at 0.000814 following a regular bullish divergence pattern on 19 October ’21 with RSI values piercing above level-75 for the first time since the price slump.
We expect a bullish campaign to kick-off from here considering that the weekly time frame of the FTTBTC also maintains a strong bullish outlook with the RSI printing higher figures above level-25 since 11 January ’21.
FTT Price Analysis: FTTUSDT Weekly Chart
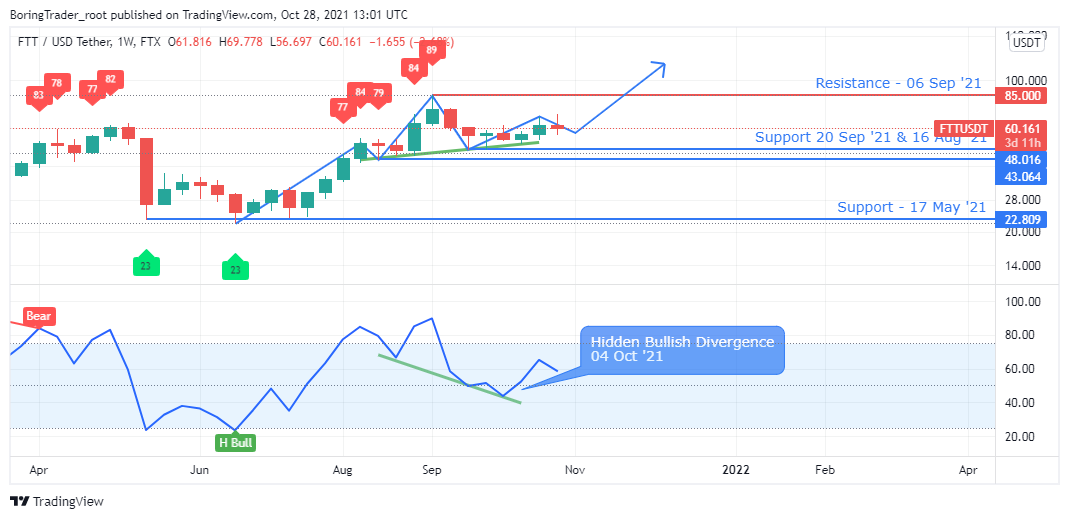
A recent hidden bullish divergence on the weekly time frame of the FTTUSDT confirms a price floor for the FTT token at $48.016 as the relative strength index prints higher values above level-25 and sets a new ATH at $85.00.
We expect the bullish campaign to persist as long as the FTT price trades above the $43.064 support and a projected 2021 all-time high above the $85.00 mark.
FTT Price Analysis: FTTUSDT Daily Chart
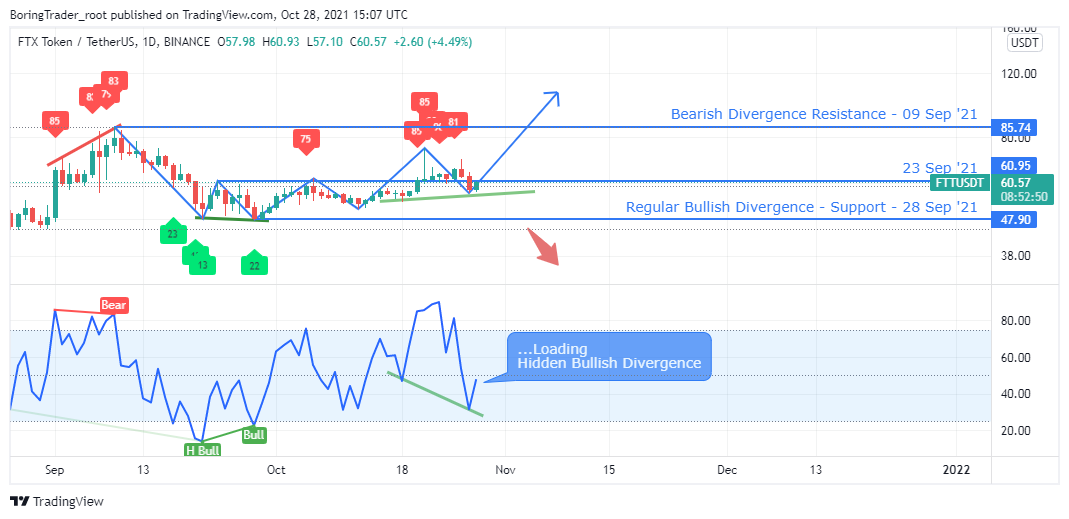
A view from the daily time frame shows the weekly time frame price floor of $48.016, this time confirmed by a regular bullish divergence pattern on 28 September ’21.
Such confluence of patterns on the weekly and daily time frame further reinforces the decision to resume the uptrend.
Furthermore, hidden bullish divergence is flagged at press time and we are set to witness an upward and parabolic wave of the FTX native cryptocurrency.
We now, notice that the RSI is printing higher readings above level-25. Let’s move to the 4HR time frame to capture the price pull-back levels.
FTT Price Analysis: FTTUSDT 4 Hr Chart
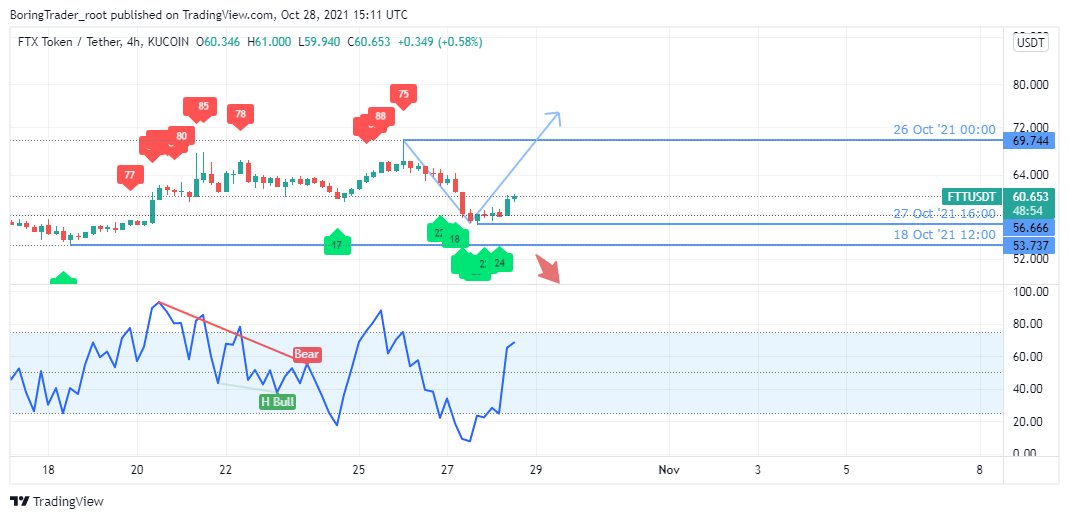
The entry and exit of oversold territory [level-25] on the intraday 4HR chart above, confirms the price bottom and uptrend observed on the daily time frame. We anticipate an increase in demand from this point as the FTT token price surge toward the $69.744 mark.

Why Trust CoinGape
CoinGape has covered the cryptocurrency industry since 2017, aiming to provide informative insights Read more… to our readers. Our journal analysts bring years of experience in market analysis and blockchain technology to ensure factual accuracy and balanced reporting. By following our Editorial Policy, our writers verify every source, fact-check each story, rely on reputable sources, and attribute quotes and media correctly. We also follow a rigorous Review Methodology when evaluating exchanges and tools. From emerging blockchain projects and coin launches to industry events and technical developments, we cover all facets of the digital asset space with unwavering commitment to timely, relevant information.

Delivered every day.
- Insights that move markets
- 100,000 active subscribers
Related Articles


- Trump Tariffs: U.S. Threatens Higher Tariffs After Supreme Court Ruling, BTC Price Falls
- Fed’s Chris Waller Says Support For March Rate Cut Will Depend On Jobs Report
- Breaking: Tom Lee’s BitMine Adds 51,162 ETH Amid Vitalik Buterin’s Ethereum Sales
- Breaking: Michael Saylor’s Strategy Makes 100th Bitcoin Purchase, Buys 592 BTC as Market Struggles
- Satoshi-Era Whale Dumps $750M BTC as Hedge Funds Pull Out Billions in Bitcoin
- Top 3 Meme Coins Price Prediction As BTC Crashes Below $67k
- Top 4 Reasons Why Bitcoin Price Will Crash to $60k This Week
- COIN Stock Price Prediction: Will Coinbase Crash or Rally in Feb 2026?
- Shiba Inu Price Feb 2026: Will SHIB Rise Soon?
- Pi Network Price Prediction: How High Can Pi Coin Go?
- Dogecoin Price Prediction Feb 2026: Will DOGE Break $0.20 This month?


