 Buy $GGs
FTX (FTT) Price Analysis: Here’s Why FTT Token Price May Go Parabolic in Next Few Months


Centralized and Decentralized Exchange tokens such as Binance BNB, Uniswap UNI, and Sushiswap SUSHI dominate the asset category. However, many traders and investors have been longing to know if the FTT token of the FTX exchange can create an upset in the crypto derivatives exchange category.
Although the BNB and UNI token set the pace for market cap, the FTT token as a fast, up-and-coming crypto asset will likely follow a similar path as the first two, and perhaps steal a part of their lunch at some point.
Recent announcements that could drive the price of the FTT token are possibilities for token burning similar to Binance BNB and expansion of FTX subsidiaries in Bahamas and Gibraltar, with the FTX digital market now recognized as a digital asset under the Bahamas Securities Commission.
Also, Scott Melker, a crypto analyst and Youtuber identified FTX Token the utility token of the FTX crypto derivatives exchange as one of the crypto assets that are currently exiting a downtrend.
Read on as we uncover how all this plays out on the price charts of the FTTUSDT below.
FTT Token Weekly Chart Analysis
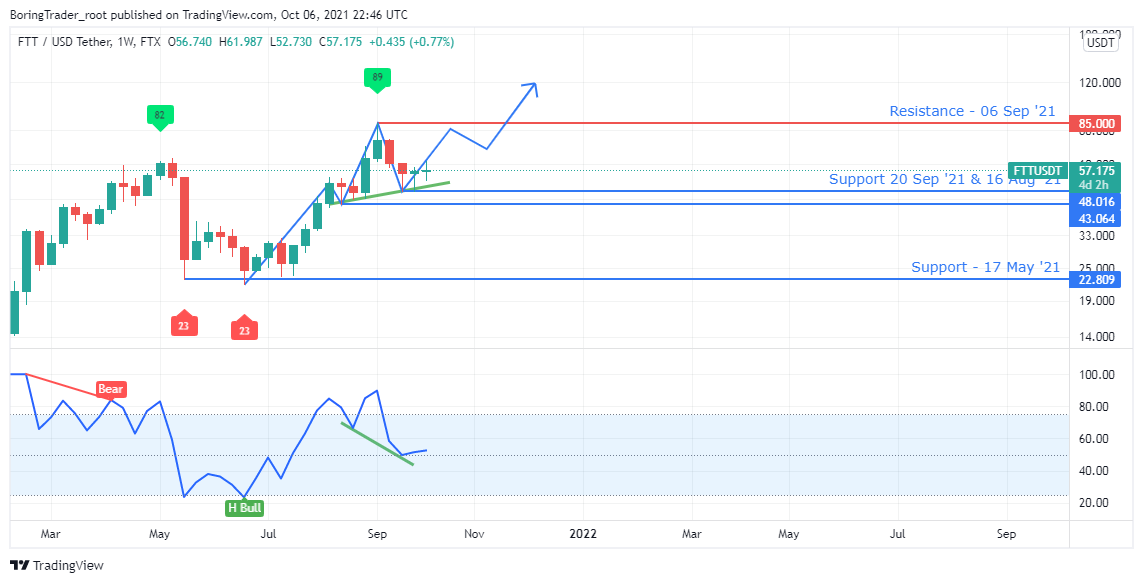
After a sector-wide price slump of the crypto market, the FTTUSDT signaled a hidden bullish divergence on 21 June ’21, sending the utility token into a parabolic trajectory by roughly 266%.
Recently, the bulls are gathering momentum and preparing for another price surge as the chart signals a second hidden bullish divergence at press time.
The $43.064 support established following a breakout of bearish hidden bar resistance $56.055 forms a confluence with the impending bullish divergence as long-term investors wait patiently for a hike in the FTT price.
FTT Token Daily Chart Analysis
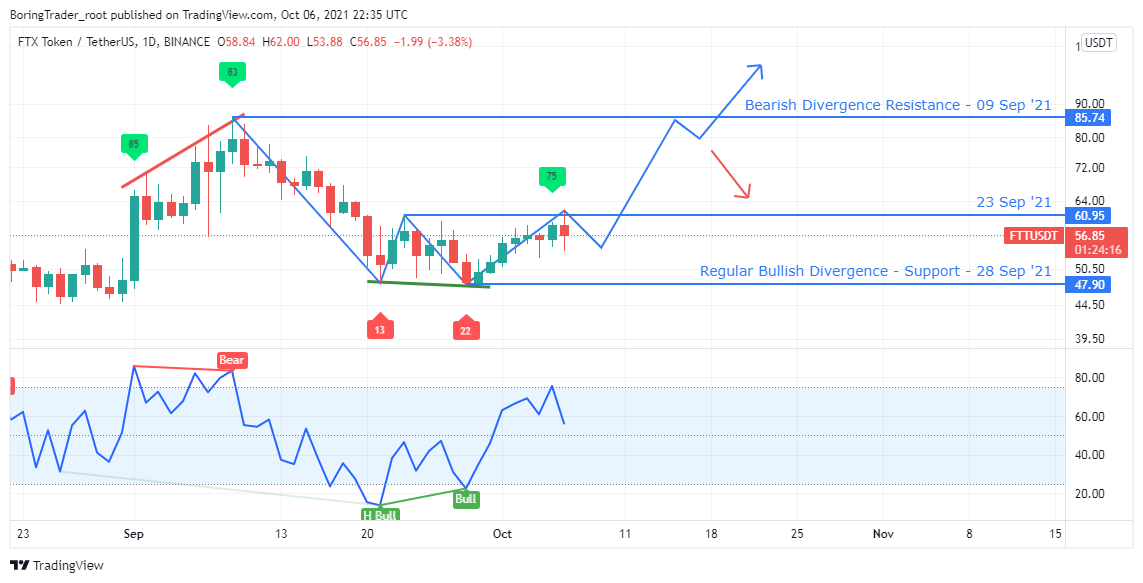
Looking at the FTT token from the daily time frame, the price slump from the 09 September price slump has found support after signaling a regular bullish divergence at $47.90.
We observe a steady increase in demand as the bulls move in to reclaim the $60.95 resistance and flipping it into new support.
Both hidden and regular bullish divergence on 21 and 28 September ’21 is enough to fuel the price surge beyond the $60.95 resistance.
FTT Token 4 Hr Chart Analysis
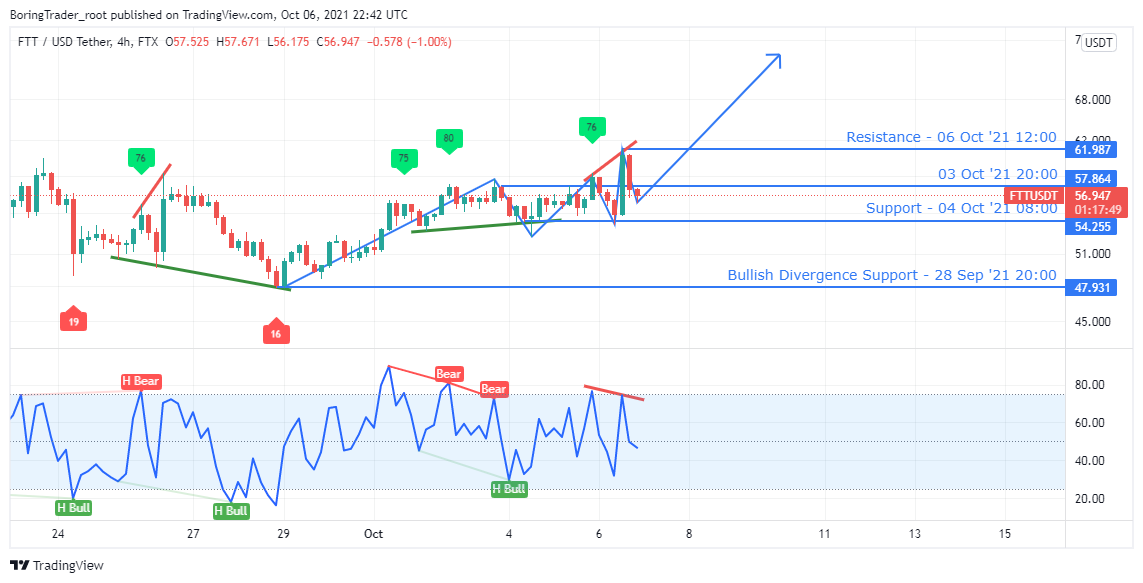
So far, the 4HR time frame also shows growing demand for the FTT token, starting with regular bearish divergence support at $47.931 on 28 Sep ’21 20:00, and followed by another bullish divergence support at $54.255.
A recent bearish divergence forces the FTTUSDT to correct its uptrend gains and threatens deeper price pull-back.
The support level at $54.255 appears to hold the bears at bay and we may see a surge in the FTT token price if the $61.987 resistance fails.
Play 10,000+ Casino Games at BC Game with Ease
- Instant Deposits And Withdrawals
- Crypto Casino And Sports Betting
- Exclusive Bonuses And Rewards


Why Trust CoinGape
CoinGape has covered the cryptocurrency industry since 2017, aiming to provide informative insights Read more… to our readers. Our journal analysts bring years of experience in market analysis and blockchain technology to ensure factual accuracy and balanced reporting. By following our Editorial Policy, our writers verify every source, fact-check each story, rely on reputable sources, and attribute quotes and media correctly. We also follow a rigorous Review Methodology when evaluating exchanges and tools. From emerging blockchain projects and coin launches to industry events and technical developments, we cover all facets of the digital asset space with unwavering commitment to timely, relevant information.

Delivered every day.
- Insights that move markets
- 100,000 active subscribers
Related Articles


- Crypto Market Update: Top 3 Reasons Why BTC, ETH, XRP and ADA is Up
- Crypto News: Bitcoin Sell-Off Fears Rise as War Threatens Iran’s BTC Mining Operations
- U.S.–Iran War: Monday Crypto Crash Odds Rise As Pundits Predict Oil Price Spike
- US-Iran War: Reports Confirm Bombings In UAE, Bahrain and Kuwait As Crypto Market Makes Recovery
- XRP Price Dips on US-Iran Conflict, But Capitulation Signals March Rebound
- Bitcoin And XRP Price As US Kills Iran Supreme Leader- Is A Crypto Crash Ahead?
- Gold Price Prediction 2026: Analysts Expect Gold to Reach $6,300 This Year
- Circle (CRCL) Stock Price Prediction as Today is the CLARITY Act Deadline
- Analysts Predict Where XRP Price Could Close This Week – March 2026
- Top Analyst Predicts Pi Network Price Bottom, Flags Key Catalysts
- Will Ethereum Price Hold $1,900 Level After Five Weeks of $563M ETF Selling?


