
How To Time Bitcoin Leg Ups With Pumps Coming Where They’re Least Expected


Bitcoin is back below $30,000 but firmly holding above support at $29,000. Although many investors are showing withdrawal symptoms due to the market doldrums, BTC price appears to be preparing for a major leg up.
BTC Price Flaunts Key Bullish Pattern
The most prominent crypto is trading at $29,360 with its price relatively unchanged in the last 24 hours. If short-term support at $29,200 holds, there is a possibility of a sudden pump, thanks to the formation of a falling wedge pattern on the four-hour.
Notably, the falling wedge pattern is a bullish formation that occurs when the price of an asset declines within a narrow range, forming a wedge-like shape on the chart.
The pattern indicates that selling pressure in Bitcoin markets is weakening and that the buyers are ready to take control.
To trade this pattern, investors should ideally look for a breakout above the upper trend line of the wedge somewhere around $29,400 in the case of Bitcoin – a move that confirms the bullish momentum.
Such a breakout is usually accompanied by a spike in volume, which adds validity to the signal. The target price would be estimated by measuring the height of the wedge and projecting it from the breakout point.
For instance, for long positions activated above 29,400 investors could anticipate a 5.77% climb to $31,074.
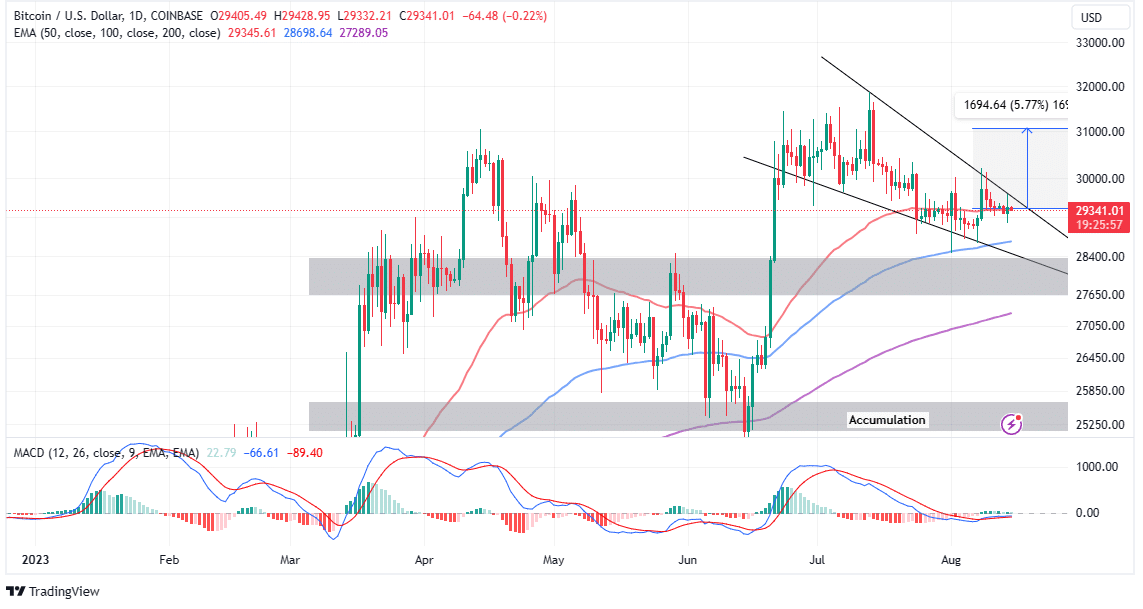
Realize that BTC needs a catalyst to rise above the stubborn resistance at $30,000 to start the run-up to the end year and a pre-halving rally likely to propel it above $40,000.
With that in mind, retail investors are likely to use the falling wedge pattern breakout as confirmation of a substantial leg up.
Likely to add credence to the bullish outlook is a potential buy signal from the Moving Average Convergence Divergence (MACD) indicator.
Traders tapping this momentum index to make their decisions would generally be on the lookout for the MACD line in blue flipping above the signal line in red. As the MACD returns into the positive region above the mean line, the path with the lease resistance would flip to the upside.
BTC Price Pain Before Gain
The investors in Bitcoin are at the moment praying for news that a breakout has occurred above $30,000 but may have to first swallow the bitter pill of a drop to collect liquidity at lower levels possibly below $29,000 but ideally not lower than $28,000 for short-term movements.
Based on the four-chart, Bitcoin holds below all the major moving averages, including the 200-day EMA (purple) at $29,432, the 100-day EMA (blue) at 29,386, and the 50-day EMA (red) at $29,372.
This position suggests that bears have the upper hand and with the MACD almost validating a sell signal in the same timeframe, BTC could close the day hovering around $29,000.
Several times Bitcoin has sought liquidity at $29,000 but failed to gather enough to propel it above $30,000.
“Bitcoin prices are infamously volatile, however, the market is currently experiencing an extreme volatility compression,” Glassnode told investors on Monday. “Whilst options markets reflect this, it suggests that Bitcoin is either no longer infamously volatile… or volatility could be mispriced.”
Therefore, a drop to $28,000 might expose the coin to buyers who would be willing to bet on a tactical rebound.
Related Articles
Play 10,000+ Casino Games at BC Game with Ease
- Instant Deposits And Withdrawals
- Crypto Casino And Sports Betting
- Exclusive Bonuses And Rewards


Why Trust CoinGape
CoinGape has covered the cryptocurrency industry since 2017, aiming to provide informative insights Read more… to our readers. Our journal analysts bring years of experience in market analysis and blockchain technology to ensure factual accuracy and balanced reporting. By following our Editorial Policy, our writers verify every source, fact-check each story, rely on reputable sources, and attribute quotes and media correctly. We also follow a rigorous Review Methodology when evaluating exchanges and tools. From emerging blockchain projects and coin launches to industry events and technical developments, we cover all facets of the digital asset space with unwavering commitment to timely, relevant information.

Delivered every day.
- Insights that move markets
- 100,000 active subscribers


- PM Modi Holds Emergency Meet as Iran Seeks India’s ‘Independent Role’ in Ending US-Iran War
- US-Iran Tensions Spike as Trump Sets 48-Hour Deadline on Strait of Hormuz Blockade
- Breaking: U.S. Prepares for Potential Peace Talks in Iran War as Trump Mulls ‘Winding Down’ Military Efforts
- Crypto Market Recovers as Expert Warns U.S. Easing of Iran Sanctions Won’t Stabilize Oil Prices
- CLARITY Act May Still Delay Despite Stablecoin Yield Deal, Galaxy’s Alex Thorn Warns
- XRP Price Prediction Ahead of March 27 SEC Spot ETF Decision
- Will Solana Price Recover This Week Amid New SEC/CFTC Crypto Rules?
- Ethereum, XRP, and Solana Price Prediction As CLARITY Act Advances After Senate–White House Deal
- Why is Pi Network Price Up Today (March 21) Despite Market Wide Correction?
- Bittensor (TAO) Price Surges 20% After Nvidia CEO Comments
- Dogecoin, Shiba Inu, and Pepe Coin Price Prediction If BTC Holds $70k Level


