KuCoin Price Analysis: KCS Price Offers Discount Opportunity Before The Next Bull Cycle Kicks In


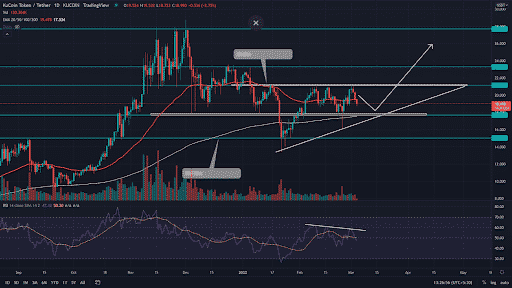
The KuCoin(KCS) chart displays the formation of an ascending triangle pattern with a solid resistance marked at $21.2 and a rising trendline supporting the higher lows. The KCS price eyes beyond the $23.5 mark, completing the bullish pattern. Moreover, the Decentralized hub DEXTools announced the integration of nine new chains, including KuCoin Community Chain (KCC).
Key technical points:
- The ascending triangle pattern could govern the KCS price
- The flattish crucial EMAS(20, 50, 100, and 200) accentuates sideways rally
- The 24-hour trading volume in the KuCoin token is $11.6 Million, indicating a 15.3% hike
 Source-Tradingview
The KCS/USDT technical chart shows the sellers have mounted stiff resistance at the $21.2 mark. Recently, the KCS price has experienced its fourth rejection from this resistance within two months, displayed by an evening star candle pattern.
In light of the ongoing conflict between Russia and Ukraine, uncertainty has gripped the crypto market, allowing the broader negative sentiment to do its work. If bears sustain the altcoin below the $21.2 resistance, the selling pressure would intensify and tumble the KCS price by another 6%($17.7).
However, along with the $17.7 horizontal level, the coin chart shows a confluence of major technical support at this mark, i.e., the 200-day EMA and ascending trendline. The buyers are expected to defend this level with vigor, suggesting a bullish reversal.
Moreover, the coin chart hints at the formation of a bullish ascending triangle pattern in the daily time frame chart. If buyers manage to break out and close above the $21.2 neckline, the coin price could spike to $23.5, followed by $27.7(All-Time High resistance)
Contrary to the bullish thesis, if sellers pull the altcoin below $17.7, the traders can expect a retest to the $15 monthly support.
Technical indicator
The Relative Strength Index(52) shows bearish divergence concerning the price action, bolstering a minor pullback before the bullish rally continues.
The recent price correction has nosedived below the crucial EMAs(20, 50, and 100). However, the coin price trading above the 200-day EMA maintains a bullish bias.
- Resistance levels– $19 and $21
- Support levels– $17.7, $16.5
Instant Currency Exchange at BestChange with Ease
- Compare Rates Across 1000+ Exchanges
- Access 250+ Cryptocurrencies & Pairs
- Save Time with Real-Time Price Tracking


Why Trust CoinGape
CoinGape has covered the cryptocurrency industry since 2017, aiming to provide informative insights Read more… to our readers. Our journal analysts bring years of experience in market analysis and blockchain technology to ensure factual accuracy and balanced reporting. By following our Editorial Policy, our writers verify every source, fact-check each story, rely on reputable sources, and attribute quotes and media correctly. We also follow a rigorous Review Methodology when evaluating exchanges and tools. From emerging blockchain projects and coin launches to industry events and technical developments, we cover all facets of the digital asset space with unwavering commitment to timely, relevant information.

Delivered every day.
- Insights that move markets
- 100,000 active subscribers