 Buy $GGs
Litecoin, Ripple Price Analysis: August 10, 2021


- Litecoin sustains the uptrend within an ascending parallel channel, rising to $170 for the first time since June.
- Ripple finds refuge above $0.8 but loses the momentum to carry one with the breakout to $1.
The bulls across the market have put their feet down for the last couple of weeks. The previous week was primarily dominate by bulls, whereby Bitcoin closed the gap to $45,000. BTC also brushed shoulders with $46,000 before stalling to allow bulls to gather the strength for the remaining breakout beyond $50,000.
Litecoin:
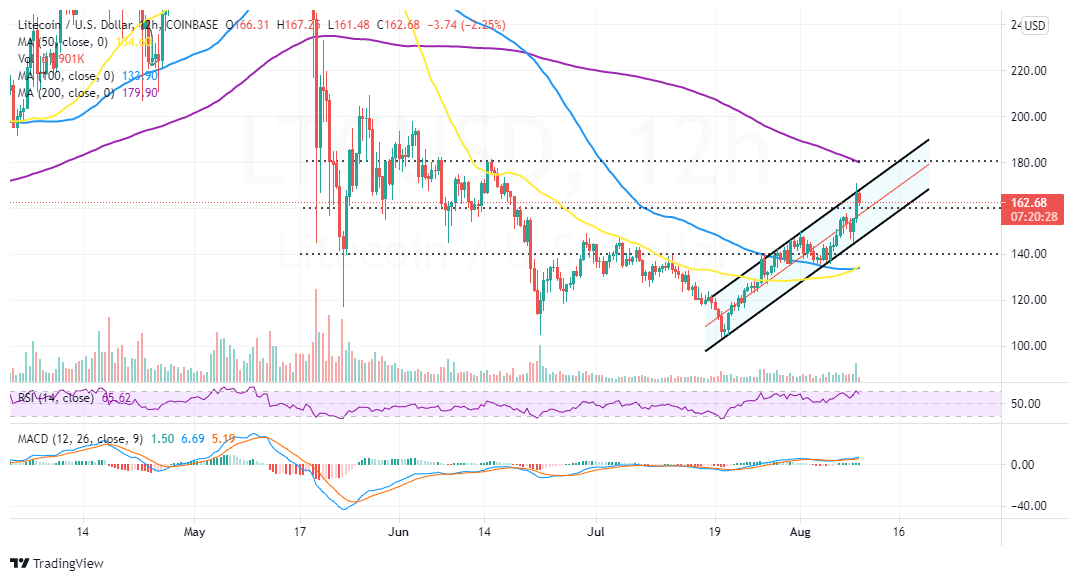
Like many crypto assets in the market, Litecoin reacted bullishly with the uptick in Bitcoin price. The selloff in July had seen LTC trim gains to $100. However, as bulls regained control across the board, a renewed uptrend came into the picture, bolstering Litecoin toward $200.
An ascending parallel channel seems to be mitigating both the bulls’ and bears’ actions. For instance, despite the majestic liftoff from $100 to $170, the channel’s upper boundary stands in the way of gains to $200.
On the other hand, the middle boundary is in line to prevent declines from stretching below $160. The buyer congestion at $160 remains crucial for the resumption of the uptrend.
Note that the Moving Average Convergence Divergence (MACD) indicator has a bullish impulse, influencing the uptrend and encouraging more buyers to join the market. Therefore, Litecoin’s bid for $200 is far from over.
LTC/USD 12-hour chart
Ripple:-
Ripple price seems to have settled above $0.8 after a rebound from the support at $0.75, confirmed on Monday. The bullish outlook from the weekend saw XRP close the gap to $0.85 but ran out of momentum to complete the journey to $1.
In addition to the buyer congestion at $0.8, support is provided to Ripple by the 200 Simple Moving Average (SMA). Realize that the MACD has a bullish signal that has been sustained since July 22. If the technical picture on the daily chart remains unchanged, XRP will quickly resume the upswing to $1.
XRP/USD Daily Chart
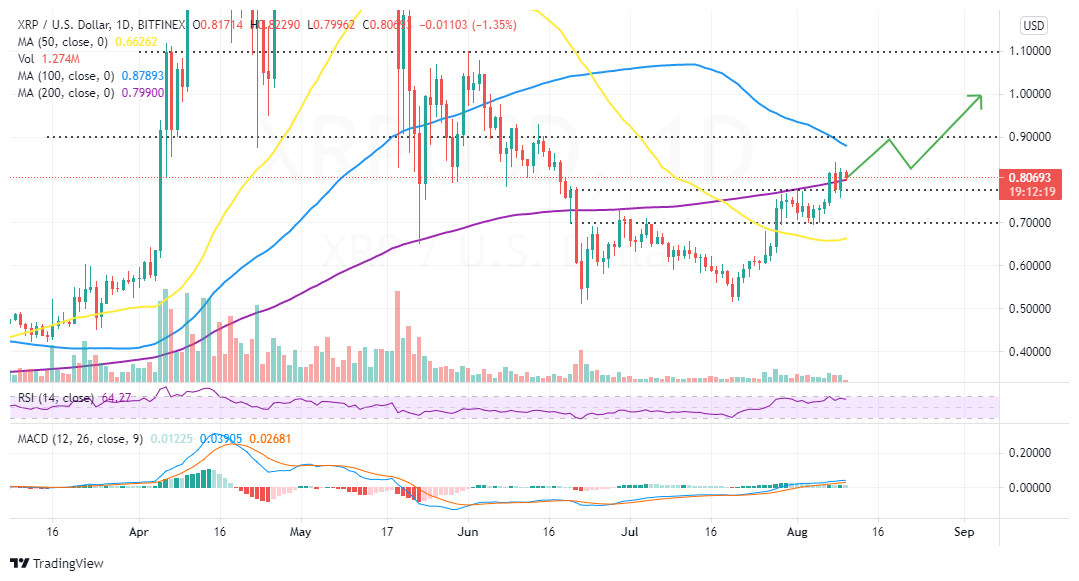
In the meantime, it is worth mentioning that a correction from the prevailing piece action is not a farfetched idea. If losses crack the 200 SMA support at $0.8, massive sell orders will be triggered. An increase in overhead pressured could trim the gains accrued in favor of losses to $0.7.
Play 10,000+ Casino Games at BC Game with Ease
- Instant Deposits And Withdrawals
- Crypto Casino And Sports Betting
- Exclusive Bonuses And Rewards


Why Trust CoinGape
CoinGape has covered the cryptocurrency industry since 2017, aiming to provide informative insights Read more… to our readers. Our journal analysts bring years of experience in market analysis and blockchain technology to ensure factual accuracy and balanced reporting. By following our Editorial Policy, our writers verify every source, fact-check each story, rely on reputable sources, and attribute quotes and media correctly. We also follow a rigorous Review Methodology when evaluating exchanges and tools. From emerging blockchain projects and coin launches to industry events and technical developments, we cover all facets of the digital asset space with unwavering commitment to timely, relevant information.

Delivered every day.
- Insights that move markets
- 100,000 active subscribers
Related Articles


- US-Iran War: Reports Confirm Bombings In UAE, Bahrain and Kuwait As Crypto Market Makes Recovery
- XRP Price Dips on US-Iran Conflict, But Capitulation Signals March Rebound
- Crypto Market at Risk as U.S.–Iran War Threatens Inflation With Oil Price Surge
- Polymarket U.S.–Iran Strike Bets Fuel Insider Trading Speculation as Crypto Traders Net $1.2M
- Cardano’s DeFi TVL Climbs as USDCx Stablecoin Launches on Network
- Top Analyst Predicts Pi Network Price Bottom, Flags Key Catalysts
- Will Ethereum Price Hold $1,900 Level After Five Weeks of $563M ETF Selling?
- Top 2 Price Predictions Ethereum and Solana Ahead of March 1 Clarity Act Stablecoin Deadline
- Pi Network Price Prediction Ahead of Protocol Upgrades Deadline on March 1
- XRP Price Outlook As Jane Street Lawsuit Sparks Shift in Morning Sell-Off Trend
- Dogecoin, Cardano, and Chainlink Price Prediction As Crypto Market Rebounds


