 Buy $GGs
LTCUSD Price Analysis: Litecoin Moving In A Near Perfect Channel


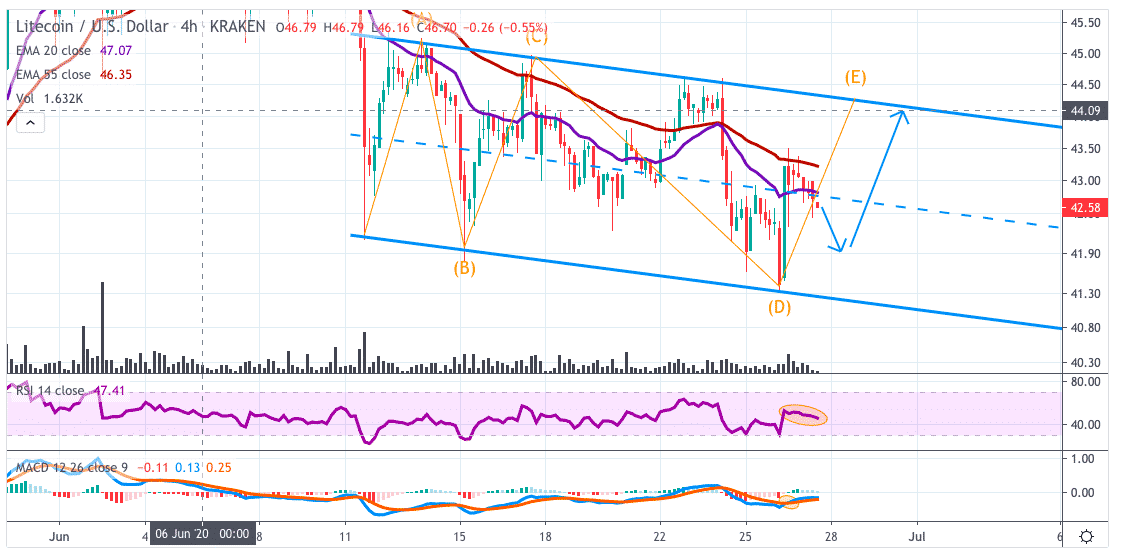
LTCUSD price is moving in a steady solid and serious channel with the lower line and upper line already touched several times which are good support and resistance levels.
LTCUSD Price Analysis: 4 Hr Chart
LTCUSD has shown some good volume and momentum this can indicate another touch of the higher line before showing more action in the levels. For now, LTCUSD is trading below the 55 and 20 EMA which is more bearish but when LTCUSD comes above the EMAs it can confirm to bullish.
RSI bounced at the oversold condition which can show an increase the next times to higher levels. Furthermore, the MACD showed a bullish crossover which can show in a price increase.
The outcome of the channel will be indispensable and show the final direction.
- TREND: Sideway
- EXPECTATION: Test of channel higher line
- TREND AFTER EXPECTATION: Confirmation either bullish or bearish
- PREV: 43.123
- OPEN: 43.126
- VOLUME: 3.193K
- DAY’S RANGE: 42.461 — 43.156
Thanks!
Play 10,000+ Casino Games at BC Game with Ease
- Instant Deposits And Withdrawals
- Crypto Casino And Sports Betting
- Exclusive Bonuses And Rewards


Why Trust CoinGape
CoinGape has covered the cryptocurrency industry since 2017, aiming to provide informative insights Read more… to our readers. Our journal analysts bring years of experience in market analysis and blockchain technology to ensure factual accuracy and balanced reporting. By following our Editorial Policy, our writers verify every source, fact-check each story, rely on reputable sources, and attribute quotes and media correctly. We also follow a rigorous Review Methodology when evaluating exchanges and tools. From emerging blockchain projects and coin launches to industry events and technical developments, we cover all facets of the digital asset space with unwavering commitment to timely, relevant information.

Delivered every day.
- Insights that move markets
- 100,000 active subscribers
Related Articles


- Breaking: Ethereum Treasury BitMine Adds 50,928 ETH as Tom Lee Predicts March Bottom For Crypto Prices
- Bitget Champions Women’s Role in Crypto as Part of International Women’s Day Campaign
- Breaking: Michael Saylor’s Strategy Adds 3,015 BTC as Bitcoin Holds Steady Despite U.S.-Iran War
- BitMine’s Tom Lee Bets on ‘March Turnaround’ to Spark Crypto Market Recovery
- Bitget Unveils MotoGP-Inspired ‘Smarter Speed Challenge’ for Crypto, Stocks, and Gold Trading in Latest UEX Push
- Pi Coin Price Prediction for March 2026 Amid Network Upgrade, KYC Boost, Rewards Distribution
- Gold Price Nears ATH; Silver Eyes $100 Breakout on Us- Iran War
- Bitcoin And XRP Price As US Kills Iran Supreme Leader- Is A Crypto Crash Ahead?
- Gold Price Prediction 2026: Analysts Expect Gold to Reach $6,300 This Year
- Circle (CRCL) Stock Price Prediction as Today is the CLARITY Act Deadline
- Analysts Predict Where XRP Price Could Close This Week – March 2026


