$200 Dip or $300 Surge? Binance Coin Price on the Verge of Major Price Shift


Amid the recent uncertainty in the crypto market, the Binance coin price shows a V-top reversal from the $261.9 high. Within a fortnight, the sellers tumbled the coins’ market value by 10% where it currently trades at $237. However, the falling prices would soon revisit the support trendline of the inverted flag pattern, offering a pivotal point for a bullish reversal or a prolonged downtrend.
Also Read: Binance Japan Announces Official Opening Date
Binance Coin Daily Chart
- A breakdown from the flag pattern’s support trendline could set the BNB price at a 14% drop
- The 50-day EMA slope offers dynamic resistance during bullish bounces
- The intraday trading volume in the BNB coin is $596.5 Million, indicating a 17.5% loss
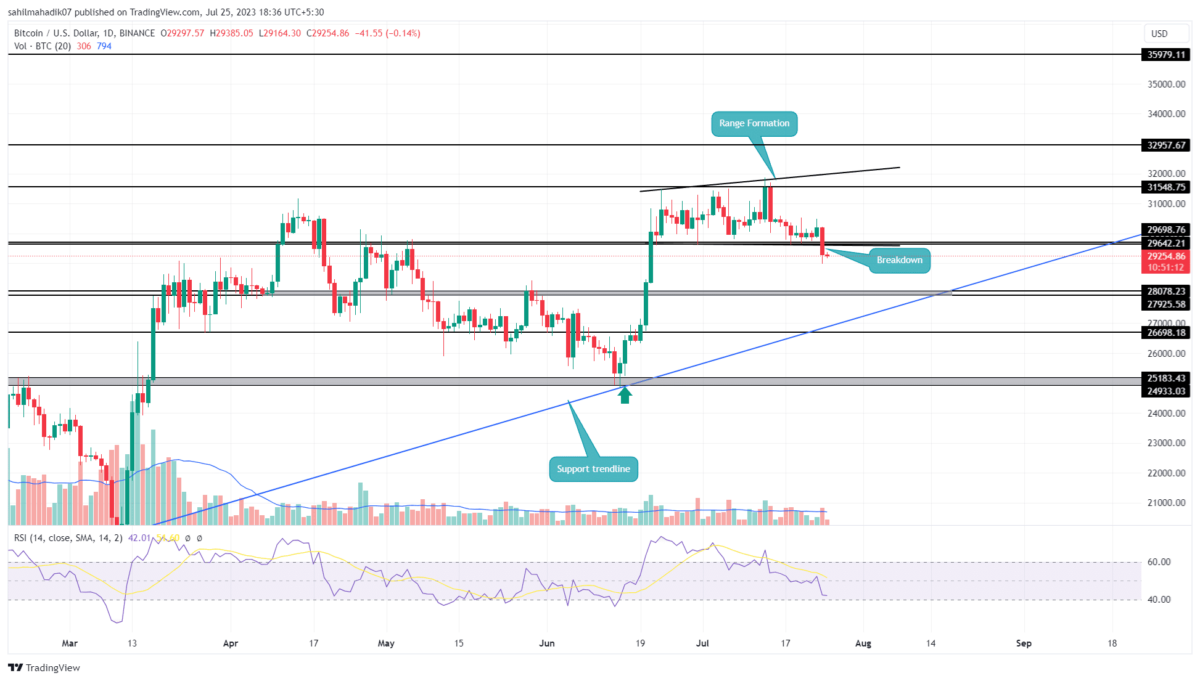
 Source- Tradingview
Concerning the April-June bloodbath and the ongoing relief rally, the Binance coin price shows the formation of an inverted flag pattern. This pattern is often spotted in an established downtrend providing a brief period of a break before the sellers recuperate exhausted bearish momentum.
With the incredible loss of 0.5%, the coin price is approaching the lower support trendline. Under the influence of a bearish continuation pattern, the Binance coin price is more likely to break this dynamic support. A daily candle closing below the aforementioned trendline will signal the resumption of the downward trend.
The post-breakdown fall could tumble the BNB price 14% and hit the $200 psychological support
[converter id=”bnb-binance-coin” url=”https://coingape.com/price/converter/bnb-to-usd/?amount=1″]
Can BNB Price Rise Back to $265?
If the coin price shows signs of reversal at the bottom support trendline, it would indicate the buyers continue to defend this dynamic support. The possible reversal could prolong the ongoing relief rally and may push the BNB price back to the overhead trendline near $265. A bullish breakout from the above resistance could invalidate the bearish thesis and trigger a sustainable recovery.
- Exponential moving average: The altcoin price trading below the daily EMAs(20, 50, 100, and 200) indicates the market participation would face the least resistance in a downward trend
- Directional moving index: A bearish crossword state where the Di-(orange) slope trades above the DI+(blue)line indicates the selling momentum is active.

Why Trust CoinGape
CoinGape has covered the cryptocurrency industry since 2017, aiming to provide informative insights Read more…to our readers. Our journal analysts bring years of experience in market analysis and blockchain technology to ensure factual accuracy and balanced reporting. By following our Editorial Policy, our writers verify every source, fact-check each story, rely on reputable sources, and attribute quotes and media correctly. We also follow a rigorous Review Methodology when evaluating exchanges and tools. From emerging blockchain projects and coin launches to industry events and technical developments, we cover all facets of the digital asset space with unwavering commitment to timely, relevant information.

Related Articles


- Fed’s Chris Waller Says Support For March Rate Cut Will Depend On Jobs Report
- Breaking: Tom Lee’s BitMine Adds 51,162 ETH Amid Vitalik Buterin’s Ethereum Sales
- Breaking: Michael Saylor’s Strategy Makes 100th Bitcoin Purchase, Buys 592 BTC as Market Struggles
- Satoshi-Era Whale Dumps $750M BTC as Hedge Funds Pull Out Billions in Bitcoin
- XRP Sees Largest Realized Loss Since 2022, History Points to Bullish Price Run: Report
- Top 3 Meme Coins Price Prediction As BTC Crashes Below $67k
- Top 4 Reasons Why Bitcoin Price Will Crash to $60k This Week
- COIN Stock Price Prediction: Will Coinbase Crash or Rally in Feb 2026?
- Shiba Inu Price Feb 2026: Will SHIB Rise Soon?
- Pi Network Price Prediction: How High Can Pi Coin Go?
- Dogecoin Price Prediction Feb 2026: Will DOGE Break $0.20 This month?


