
5 Reasons Why You Should Look at Ethereum Price Today


Highlights
- A symmetrical triangle pattern drives the mid-term sideways trend in Ethereum price.
- The 365-day MVRV ratio around 13.7% hints at a possible long-term recovery.
- 15% decline in 24-hour active addresses and a steady rise in ETH supply since July suggest weaker network activity and increased selling potential.
The Ethereum price showed a modest drop of 0.3% during the U.S. Trading session on Wednesday, currently trading at $2432. This neutral candle formation projects indecisive market sentiment with no clear dominance of buyers or sellers. While the ETH price consolidation trend continues, these 5 reasons could drive Ether into a more directional trend.
Ethereum’s MVRV Ratios Hint at Potential Long-Term Recovery
According to Santiment data, the 365-day Market Value to Realized Value (MVRV) stabilizes around -13.7%. The ratio provides valuable insights into the profitability of Ethereum holders over the past year, aka long-term holders.
Historically, a deep negative value has coincided with major market bottoms, as observed in June 2022 and October 2023. Thus, The ethereum price could prepare for a major recovery trend in the mid to long-term period.

In addition, the on-chain data shows a recent rebound in the 30-day MVRV ratio, an indicator that tracks the profitability of short-term holders over the past 30 days compared to its market price.
After hitting a low -21% in August, the MRVR ratio has notably surged to -1.35%, suggesting that short-term holders are beginning to recover and could fuel renewed buying interest in the market.

Analyst Warns of Ethereum Drop to $2350
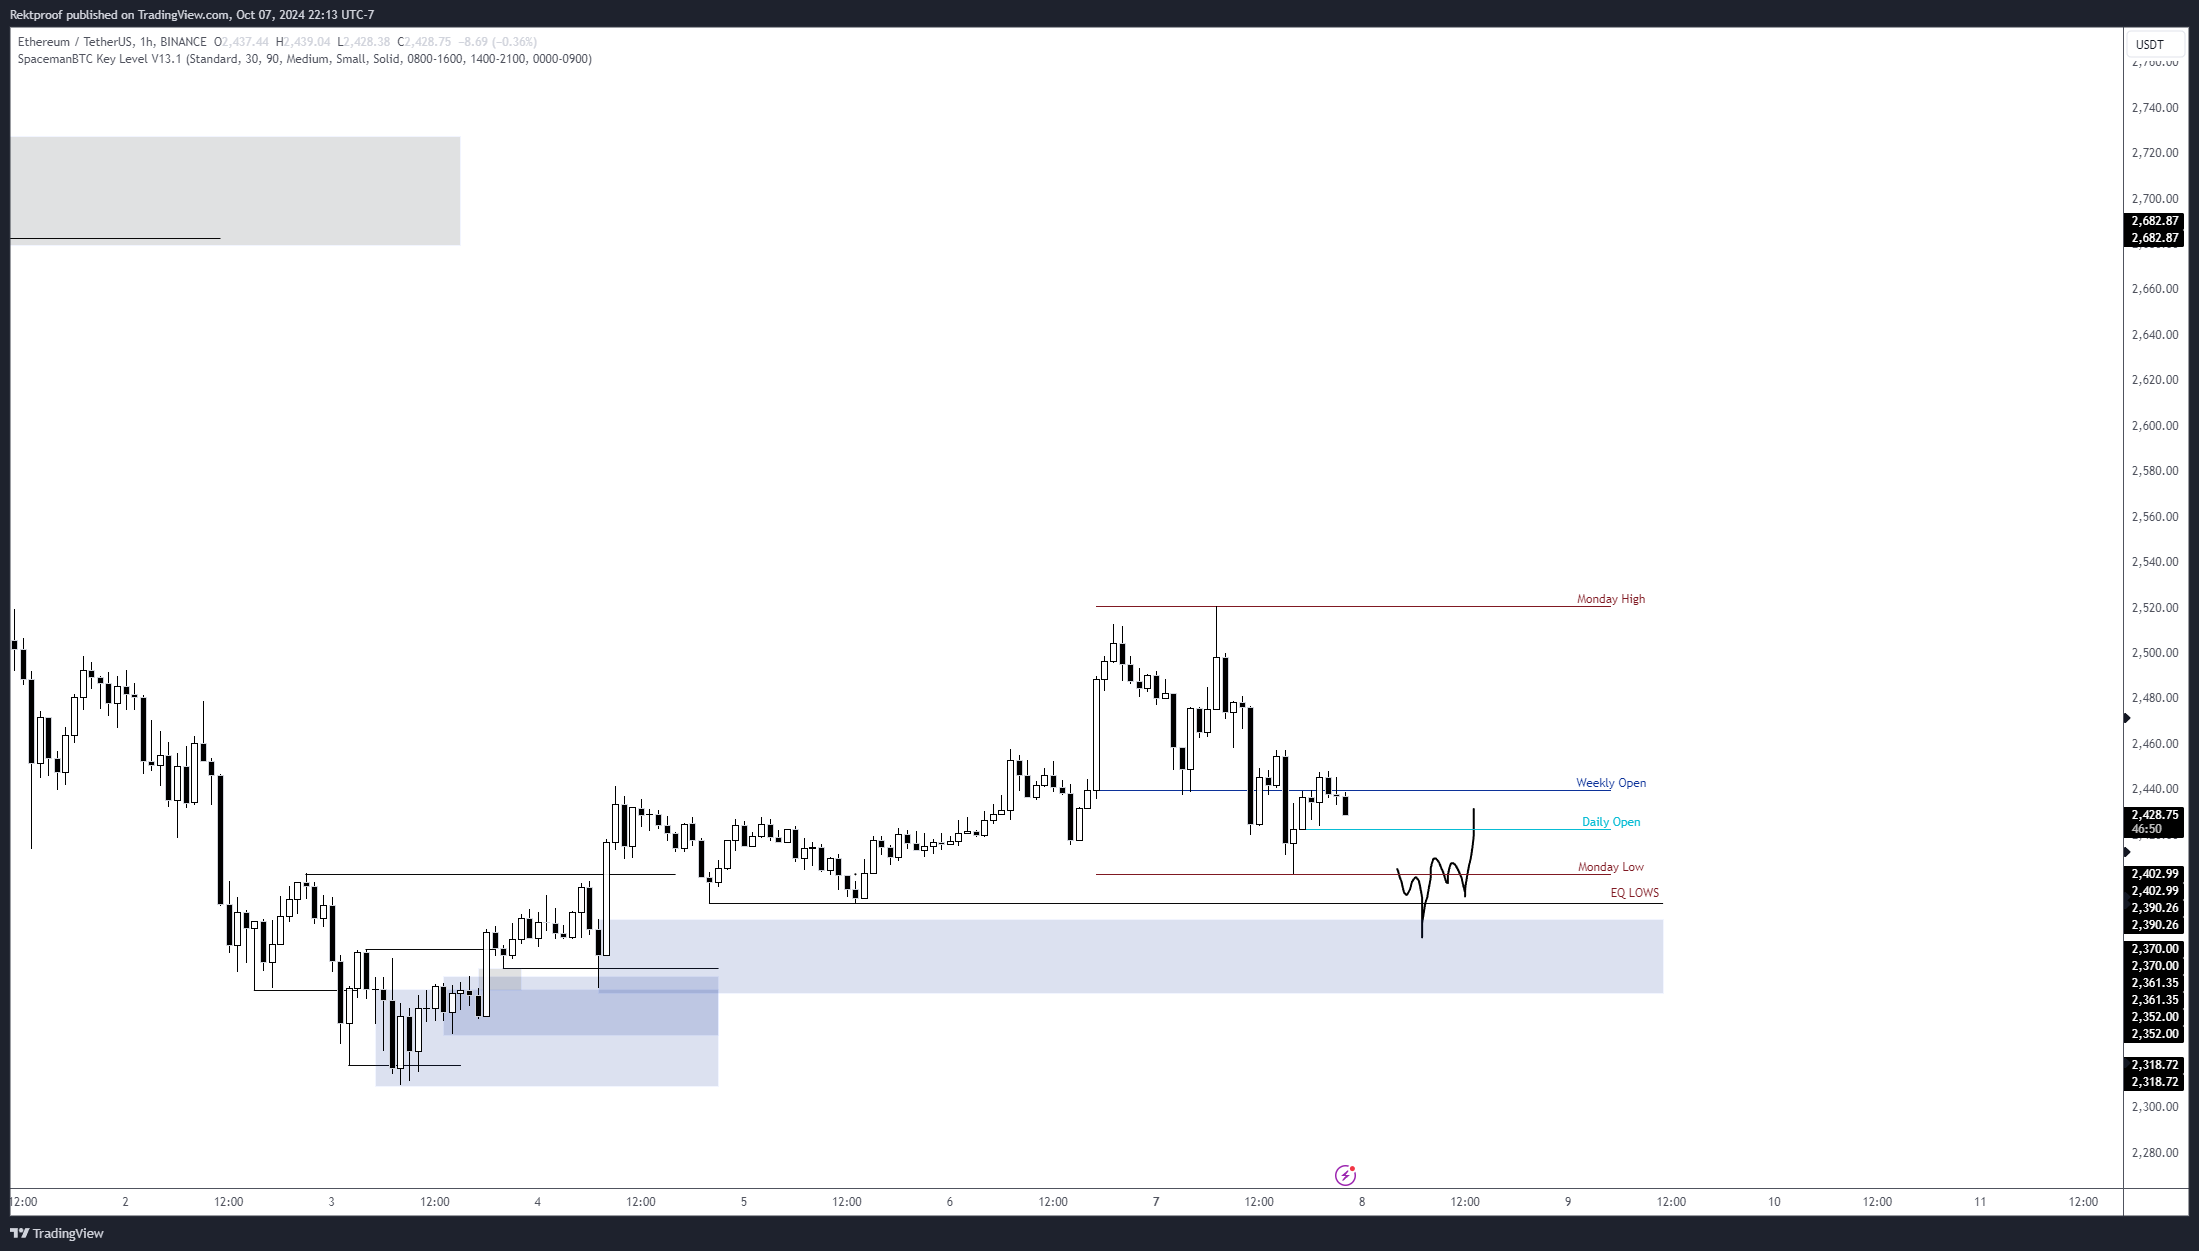
Since last week, the ETH price has shown a notable bounce from $2300 to $2460, accounting for a 6% surge. However, the overhead supply has rejected the price sharply and plunged below the $2460 weekly open, as shown in Rektproof’s chart analysis.
If the BTC price shows a lack of bullish momentum, the Ethereum price could plunge to $2350 and retest the accumulation zone of the hourly chart. The support could recuperate the bullish momentum for a sustained reversal.
Declining Active Addresses and Rising ETH Supply Suggest Bearish Outlook
Since the onset of October, the 24-hour active addresses in the ETH network have declined from 512.8k to 434.2K— a 15% drop. This decrease in active addresses suggests a reduction in the number of participants engaging with the Ethereum network daily. Such a decline may indicate waning interest and support a short-term bearish outlook for Ether.

Furthermore, the ETH supply has steadily risen since July 2024, coinciding with the extended price correction below $3000. An increasing trend in this indicator is that investors have been moving their assets into exchange, increasing selling potential.
Moreover, whale transactions (involving more than 100k ETH) have remained consistently low, staying under 1000 since mid-August. This sluggish activity among large holders during the recent price rebound suggests that the recovery did not capture much attention from these key market participants.

Ethereum Foundation Wallet Moves 2,500 ETH to Bitstamp
In a recent on-chain transaction, a wallet linked to the Ethereum Foundation transferred 1,200 ETH (worth approximately $3.03 million) to the Bitstamp exchange. According to Lookonchain, this wallet received 51,251 ETH from the Ethereum Foundation on November 17, 2015, valued at $51.2K back then and worth $124.5 million at current prices.
These large transactions, especially from foundation-linked wallets, often create market uncertainty or trigger temporary volatility in the market.
A wallet related to the #EthereumFoundation deposited 1,250 $ETH($3.03M) to #Bitstamp 20 mins ago.
On Nov 17, 2015, the wallet received 51,251 $ETH($51.2K at that time, $124.5M currently) from the #EthereumFoundation.https://t.co/RV8HZrxgKH pic.twitter.com/uHQJH2Itp7
— Lookonchain (@lookonchain) October 8, 2024
Symmetrical Triangle Pattern Hints Potential Move
In the last two months’ consolidation, the Ethereum price prediction daily chart shows a symmetrical triangle formation. Theoretically, the chart pattern drives a temporary consolidation within two converging trendlines before a directional rally.
If the anticipated drop in ETH price breaks below the lower support trendline, the accelerated selling pressure could drive a fall from $2200 to $2000.

On the contrary note, the triangle pattern breakout around $2600 could replenish the bullish momentum for a rally above $3000 psychological resistance.
Play 10,000+ Casino Games at BC Game with Ease
- Instant Deposits And Withdrawals
- Crypto Casino And Sports Betting
- Exclusive Bonuses And Rewards

Frequently Asked Questions (FAQs)
1. Why Should You Look at Ethereum's Price Today?
2. Why might Ethereum price drop to $2350 according to analysts?
3. How have active addresses and ETH supply trends impacted Ethereum’s price outlook?

Why Trust CoinGape
CoinGape has covered the cryptocurrency industry since 2017, aiming to provide informative insights Read more…to our readers. Our journal analysts bring years of experience in market analysis and blockchain technology to ensure factual accuracy and balanced reporting. By following our Editorial Policy, our writers verify every source, fact-check each story, rely on reputable sources, and attribute quotes and media correctly. We also follow a rigorous Review Methodology when evaluating exchanges and tools. From emerging blockchain projects and coin launches to industry events and technical developments, we cover all facets of the digital asset space with unwavering commitment to timely, relevant information.


- TRUMP Coin Whales Reach 5-Month High Ahead Gala Luncheon For Top Token Holders
- CLARITY Act: Crypto Industry and Banks Near Deal as Bill’s Odds Jump Above 60%
- Breaking: Trump Says Iran Wants To Make A Deal With U.S., Bitcoin Rises
- Top 3 factors Why XRP Price is Skyrocketing Today (16th March)
- Ethereum Targets $4K as Peter Brandt Flags Potential ETH Bottom
- MSTR Stock Prediction as Strategy Makes Largest Bitcoin Purchase in 2026 and Analyst Targets BTC Price $100K
- Pi Network Price Prediction After Smart Contract and Second Migration Launch
- Pepe Coin Price Surges 20%- How High Can it Go in March?
- Is XRP Price Gearing Up For $2 Level As BTC Rebounds Above $74k?
- Cardano’s $0.50 Resistance- Can “Midnight” Alpha Defy the Fog of War?
- Bitcoin and XRP Price Outlook If the Senate Banking Committee Approves the CLARITY Act


