Aave Price Analysis: Reversal From Support Trendline Hints 18% Jump


For more than two months, the AAVE price has been lowering under the influence of a falling wedge pattern. On June 19th, the altcoin rebounded from the combined support of $50 and support trendline, triggering a new bull cycle within the pattern. Can the upcoming bull run breach the overhead resistance trendline?
Key points:
- The AAVE price has gained 22.5% in just two days.
- Falling wedge pattern breakout may surge AAVE price to $260.
- The intraday trading volume in AAVE/USD is $213 Million, indicating a 15% gain.
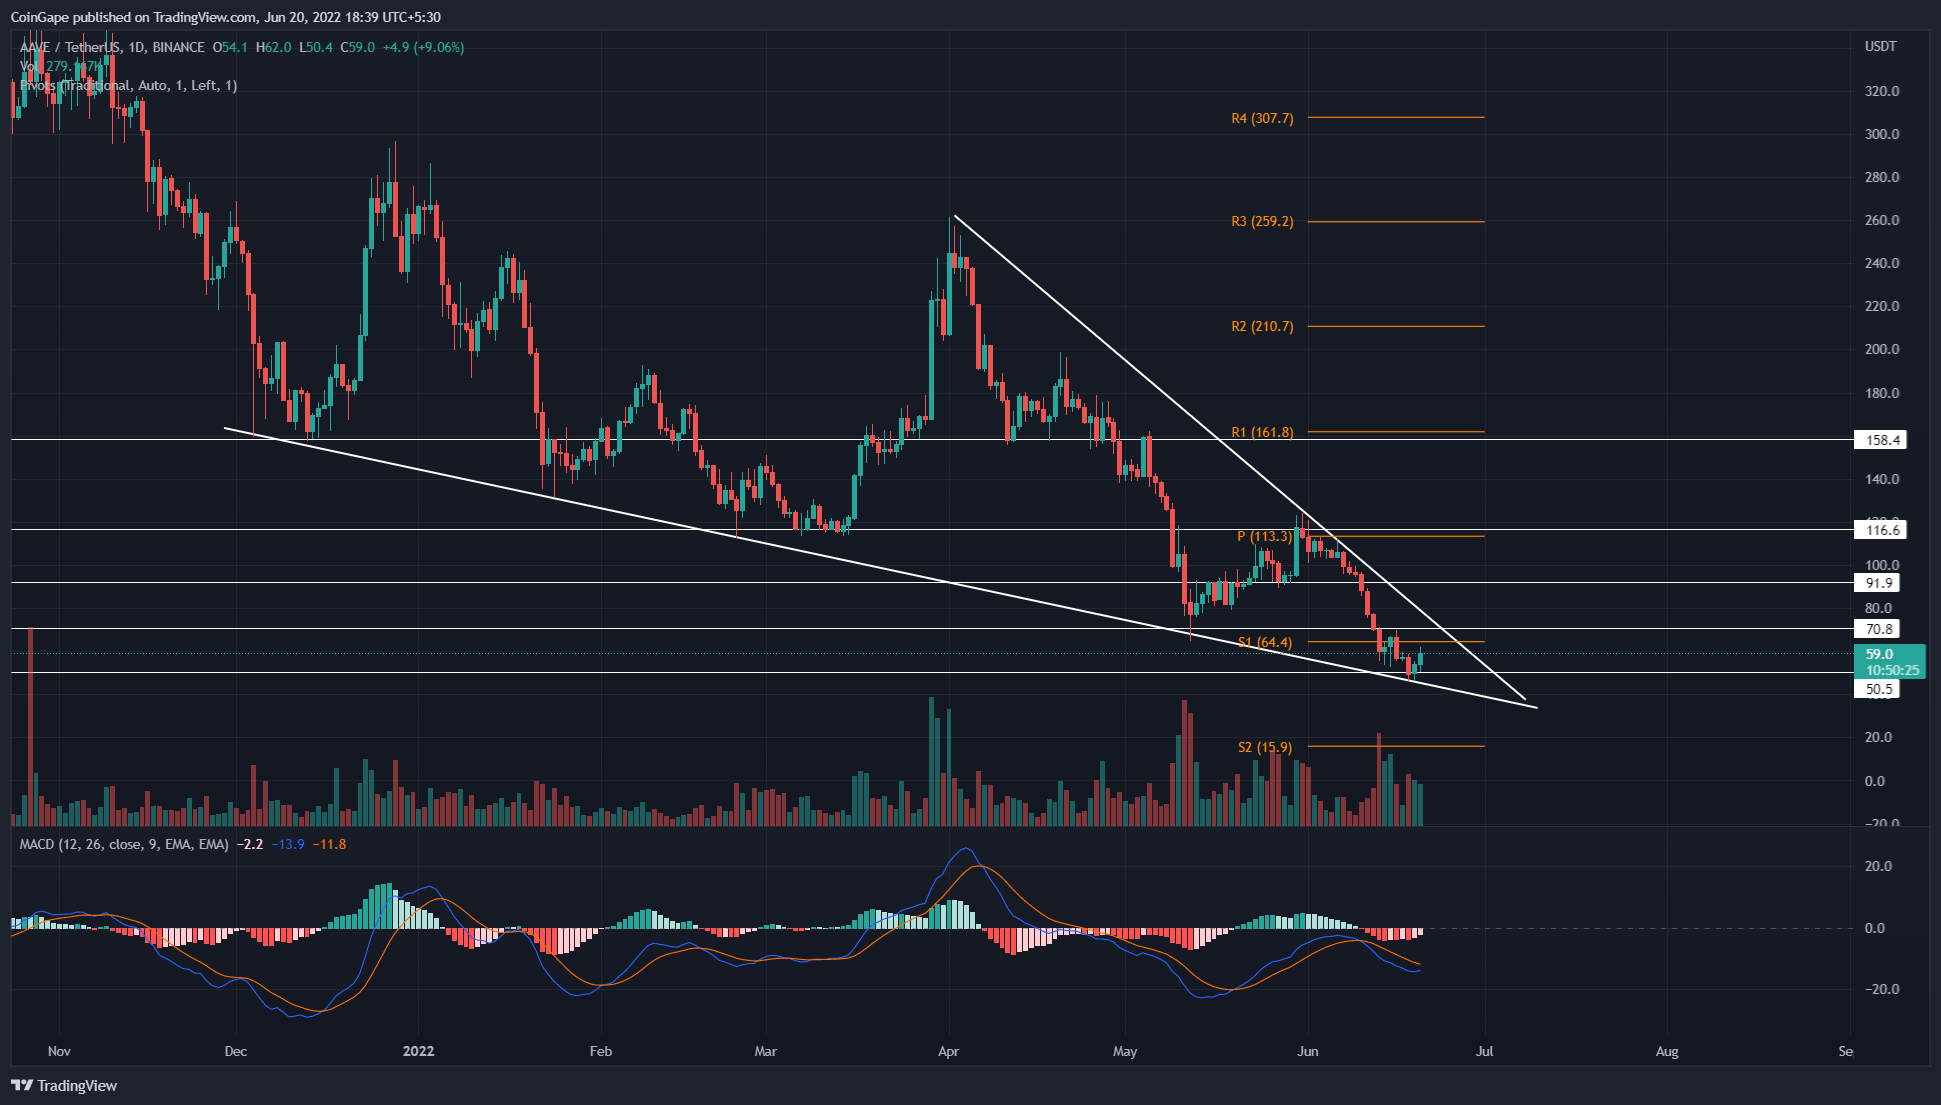 Source- Tradingview
The AAVE/USDT technical chart showcase a support trendline restricting excessive selling from traders since mid-dec 2021. However, on the flip side, the chart also displays a downsloping resistance trendline that carried the recent April-May downfall.
The price action wobbling within these two trendlines indicates the formation of a falling wedge pattern. In addition, the AAVE price gradually narrowing inside this bullish reversal pattern can soon offer a breakout trade.
Furthermore, amid the June second-week sell-off, the AAVE price slumped to the bottom trendline to replenish the bullish momentum. Today, the altcoin is up 12% and rebounded from the support trendline with a morning star candle.
The sustained buying may drive the AAVE price 18% higher to rechallenge the overhead trendline. Moreover, under a strong bullish scenario, the altcoin could breach the overhead trendline and offer coin holders a 271% growth opportunity.
Anyhow, until the buyers don’t surpass the resistance trendline, the coin price will continue its downward spiral.
Technical indicator
A bullish divergence in the MACD indicator despite a falling price increases breakout possibility from the wedge pattern. The fast and slow lines nearing a positive crossover bolster the current reversal.
The traditional pivot levels aligned with some chart levels increase their weightage as support or resistance. These levels are $16.2 paired with the S2 pivot level, $70-65 paired with S1, and $115 paired with the pivot(P).
- Resistance levels: $70 and $115
- Support levels: $49.8 and $27.4

Why Trust CoinGape
CoinGape has covered the cryptocurrency industry since 2017, aiming to provide informative insights Read more…to our readers. Our journal analysts bring years of experience in market analysis and blockchain technology to ensure factual accuracy and balanced reporting. By following our Editorial Policy, our writers verify every source, fact-check each story, rely on reputable sources, and attribute quotes and media correctly. We also follow a rigorous Review Methodology when evaluating exchanges and tools. From emerging blockchain projects and coin launches to industry events and technical developments, we cover all facets of the digital asset space with unwavering commitment to timely, relevant information.

Related Articles

- CLARITY Act: Banks and Crypto Make Progress Following “Constructive” Dialogue at White House Meeting
- Expert Warns Bitcoin Bear Market Just In ‘Phase 1’ as Glassnode Flags BTC Demand Exhaustion
- SEC Chair Reveals Regulatory Roadmap for Crypto Securities Amid Wait for CLARITY Act
- ProShares Launches First GENIUS Act Focused Money Market ETF, Targeting Ripple, Tether, Circle
- BTC Price Falls as Initial Jobless Claims Come In Below Expectations
- Top 3 Price Predictions Feb 2026 for Solana, Bitcoin, Pi Network as Odds of Trump Attacking Iran Rise
- Cardano Price Prediction Feb 2026 as Coinbase Accepts ADA as Loan Collateral
- Ripple Prediction: Will Arizona XRP Reserve Boost Price?
- Dogecoin Price Eyes Recovery Above $0.15 as Coinbase Expands Crypto-Backed Loans
- BMNR Stock Outlook: BitMine Price Eyes Rebound Amid ARK Invest, BlackRock, Morgan Stanley Buying
- Why Shiba Inu Price Is Not Rising?


