ADA Price Analysis: Will Market FUD Lead Cardano Correction to $0.2?


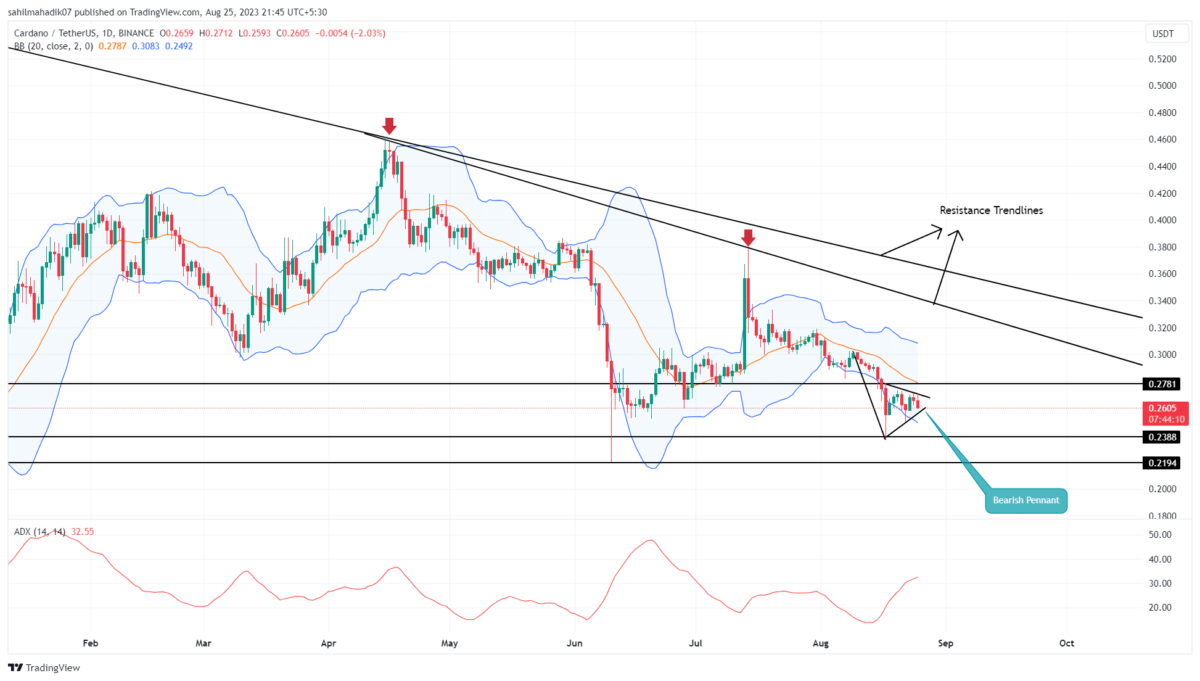
In response to the consolidation phase in the market leaders Bitcoin and Ethereum, several cryptocurrencies have witnessed increased volatility since last week. As a result, the Cardano coin shows candles with long-wicks rejection on either side reflecting the uncertain behavior. However, a noteworthy pattern has emerged on the daily chart, characterized by a downward movement transitioning into a sideways trajectory. This particular price action formation resembles a bearish pennant pattern.
Also Read: Cardano Scaling Tool Hydra Welcomes Significant Update
Cardano Daily Chart: Key Points
- The ADA price resonating within a triangle structure can be considered a no-trading zone.
- A bullish breakout from the upper trendline of the pennant pattern could surge the altcoin price by 16%
- The intraday trading volume in the ADA coin is $234 Million, indicating a 22.3% gain
 Source- Tradingview
Over the past eight days, the ADA price trading sides have been confined within two converging trendlines, which mirrors the prevailing market sentiment of uncertainty. A closer examination of the 4-hour chart reveals the emergence of a triangular shape, indicating the development of a pennant pattern.
Pennant patterns are often observed within downtrends and serve as brief interludes that allow for a temporary pause in the prevailing bearish momentum, thereby extending the preceding trend. As of the current observation, the Cardano coin is exchanging hands at $0.267, reflecting an intraday loss of 1.8%.
With a recent reversal from the pattern’s upper trendline, the price action is poised to challenge the lower support. In addition, a higher probability scenario involves Cardano’s price breaking below the lower trendline, an action that could potentially amplify the selling pressure.
Such a breakdown could trigger a subsequent decline of approximately 15%, pushing the price downward to revisit the low point recorded in June, at $0.22.
[converter id=”ada-cardano” url=”https://coingape.com/price/converter/cardano-to-usd/?amount=1″]
Can Cardano Coin Reclaim $0.3 Mark?
If the ADA price gives a bullish breakout from the triangle shape or rebounds from $0.22 support, the upward trajectory could still be limited to $0.3 as the buyers may face a downsloping resistance trendline around it. The daily chart shows two such resistance trendlines, which are offering strong resistance during bullish bounces. For potential investors to get a better confirmation for trend reversal, the coin price must break above these barriers.
- Average Directional Index: The rising ADX slope reflects the seller’s strength to prolong the correction trend
- Bollinger Band: The downsloping lower band of the Bollinger band indicator reflects the underlying selling momentum is still aggressive.

Why Trust CoinGape
CoinGape has covered the cryptocurrency industry since 2017, aiming to provide informative insights Read more…to our readers. Our journal analysts bring years of experience in market analysis and blockchain technology to ensure factual accuracy and balanced reporting. By following our Editorial Policy, our writers verify every source, fact-check each story, rely on reputable sources, and attribute quotes and media correctly. We also follow a rigorous Review Methodology when evaluating exchanges and tools. From emerging blockchain projects and coin launches to industry events and technical developments, we cover all facets of the digital asset space with unwavering commitment to timely, relevant information.

Related Articles


- NYSE’s Tokenized Securities Plan ‘Bullish’ for Crypto, Binance’s Founder CZ Says
- Grant Cardone’s Cardone Capital Adds More Bitcoin Amid Crypto Market Dip
- CLARITY Act’s ‘Drastically Higher’ Disclosure Thresholds Could Push Crypto Projects Abroad, Coinbase Warns
- Trump Tariffs: China Warns U.S. on Greenland as Supreme Court Ruling Nears
- Crypto Traders Bet Against U.S. Government Shutdown Despite Looming Jan. 30 Deadline
- Top 3 Price Prediction for Ethereum, XRP and Bitcoin If Crypto Structure Bill Passes This Month
- Dogecoin Price Eyes a 20% Rebound Ahead of SCOTUS Ruling on Trump’s Tariffs
- Bitcoin Price Prediction Amid US-EU Tariff Tension
- XRP Price Prediction 2026: Will Price Rebound After Today’s Crash?
- Will Bitcoin, Ethereum, and XRP Prices Hit New Highs If the Clarity Act Is Approved This Year?
- MSTR Stock Price Prediction Amid Vanguard’s First-Ever $505M Buy as VanEck Goes Bullish


