
ADA Price to Revisit Multi-Month Support of $0.24, Time to Accumulate?


Amid the recent fluctuations in the crypto space, the ADA price struggled to maintain its position above the recently reclaimed $0.258 threshold, hinting at a potential bull trap. With the price retracting below the $0.258 mark, we could witness accelerated selling momentum, potentially driving the price toward the multi-month support at $0.2. Is it the best time to buy?
Also Read: Charles Hoskinson Reveals Major Cardano Updates
Will $0.24 Hold Strong Amid Current Market Downturn
- The falling ADA price could see a 5.5% loss before hitting the next significant support of $0.24.
- The $0.24 level continues to remain a strong demand zone for coin traders.
- The intraday trading volume in the ADA coin is $108 Million, indicating a 30% gain
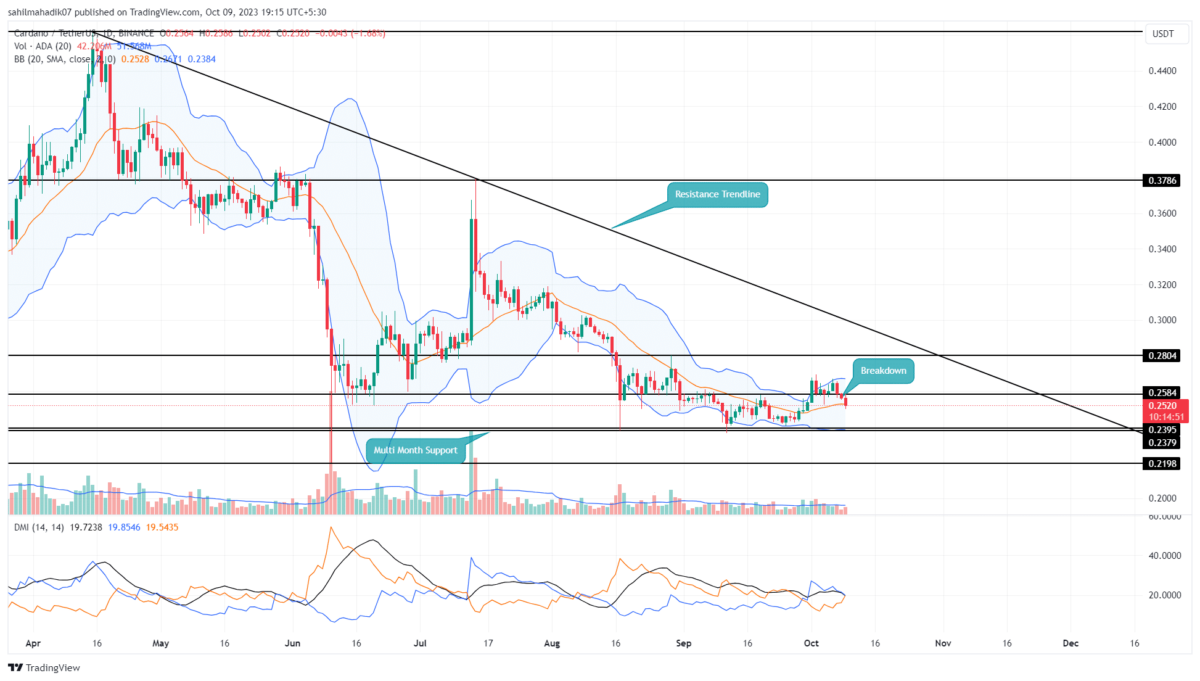
 Source- Tradingview
For the past couple of months, the Cardano price trajectory has been notably stable, consistently hovering above the crucial $0.24 support level. This period saw multiple rebounds from this level, suggesting a robust accumulation sentiment among crypto buyers.
Toward the end of September, the ADA price saw a noteworthy upturn from the $0.24 base, surging by 12%. However, the recent geopolitical tensions stemming from the Israel-Hamas conflict in the Middle East. both stocks and cryptocurrencies experiencing a slump.
Consequently, this altcoin’s momentum faltered, failing to secure its stance above the pivotal $0.258 mark. If the prevailing bearish pressure continues, the ADA price might be steered further downwards, potentially by another 5%, targeting the foundational support at $0.02.
Historically, this level has consistently acted as a springboard, signaling its potential to catalyze another upward shift. Hence, a potential bounce from this juncture could propel the prices by approximately 15%, targeting the $0.28 mark, which coincides with a long-standing resistance trendline.
Will the ADA Price Surpass the $0.3 mark?
Delving into the daily timeframe, the ADA price appears to be conscientiously reverting between two pivotal technical markers: the $0.24 horizontal support and a descending resistance line. As long as these two landmarks remain unbreached, the coin price might extend its lateral movement. Therefore, piercing above this pattern’s upper boundary could serve as a robust indicator of an impending bullish resurgence, potentially driving the Cardano coin’s valuation north of $0.3.
- Directional Movement Index: A potential bearish crossover between the DI+(blue) and DI(pink) orange slope supports a correction to the $0.024 level.
- Bollinger Band: The lower boundary of the Bollinger Band wavering along $0.24 increases the support strength of this level.
Play 10,000+ Casino Games at BC Game with Ease
- Instant Deposits And Withdrawals
- Crypto Casino And Sports Betting
- Exclusive Bonuses And Rewards


Why Trust CoinGape
CoinGape has covered the cryptocurrency industry since 2017, aiming to provide informative insights Read more…to our readers. Our journal analysts bring years of experience in market analysis and blockchain technology to ensure factual accuracy and balanced reporting. By following our Editorial Policy, our writers verify every source, fact-check each story, rely on reputable sources, and attribute quotes and media correctly. We also follow a rigorous Review Methodology when evaluating exchanges and tools. From emerging blockchain projects and coin launches to industry events and technical developments, we cover all facets of the digital asset space with unwavering commitment to timely, relevant information.
24 Hours volume
$533.2M
Market Cap
$10.02B
Max Supply
45B


- US-Iran War Related Panic Is Being Used for Crypto Scams: ZachXBT
- Breaking: Bitcoin Spikes as U.S. And Iran Have Talks To End War
- RWA News: US House Tokenization Hearing This Week- What to Expect
- Breaking: Prediction Markets Ban Widens as US Senators Push Bipartisan Bill to Crack Down on Sports Betting
- $1.6T Franklin Templeton Reveals Why They Are Betting Big on XRP
- XRP Price Prediction Ahead of March 27 SEC Spot ETF Decision
- Will Solana Price Recover This Week Amid New SEC/CFTC Crypto Rules?
- Ethereum, XRP, and Solana Price Prediction As CLARITY Act Advances After Senate–White House Deal
- Why is Pi Network Price Up Today (March 21) Despite Market Wide Correction?
- Bittensor (TAO) Price Surges 20% After Nvidia CEO Comments
- Dogecoin, Shiba Inu, and Pepe Coin Price Prediction If BTC Holds $70k Level


