After a 17% Jump, Is Litecoin Price Rebound Sustainable Amid Dominant Sell Activity?


Highlights
- Litecoin price rebounds 17% and tests a crucial resistance near $102 for potential breakout.
- DMI and MACD indicators confirm a bullish setup, hinting at growing buyer strength.
- Despite persistent sell activity, Litecoin remains resilient and consolidates near key resistance.
The Litecoin price has shown impressive resilience after recording a sharp 17% rebound in just one day. The LTC price has regained investors’ attention as it hovers near a key resistance zone that could define its next big move. This renewed strength comes amid profit-taking pressure and cautious optimism among participants. The focus now rests on whether Litecoin can sustain this short-term recovery and confirm a lasting breakout. With technical patterns tightening, the upcoming sessions will reveal if buyers truly have the upper hand.
Litecoin Price Action Near Breakout
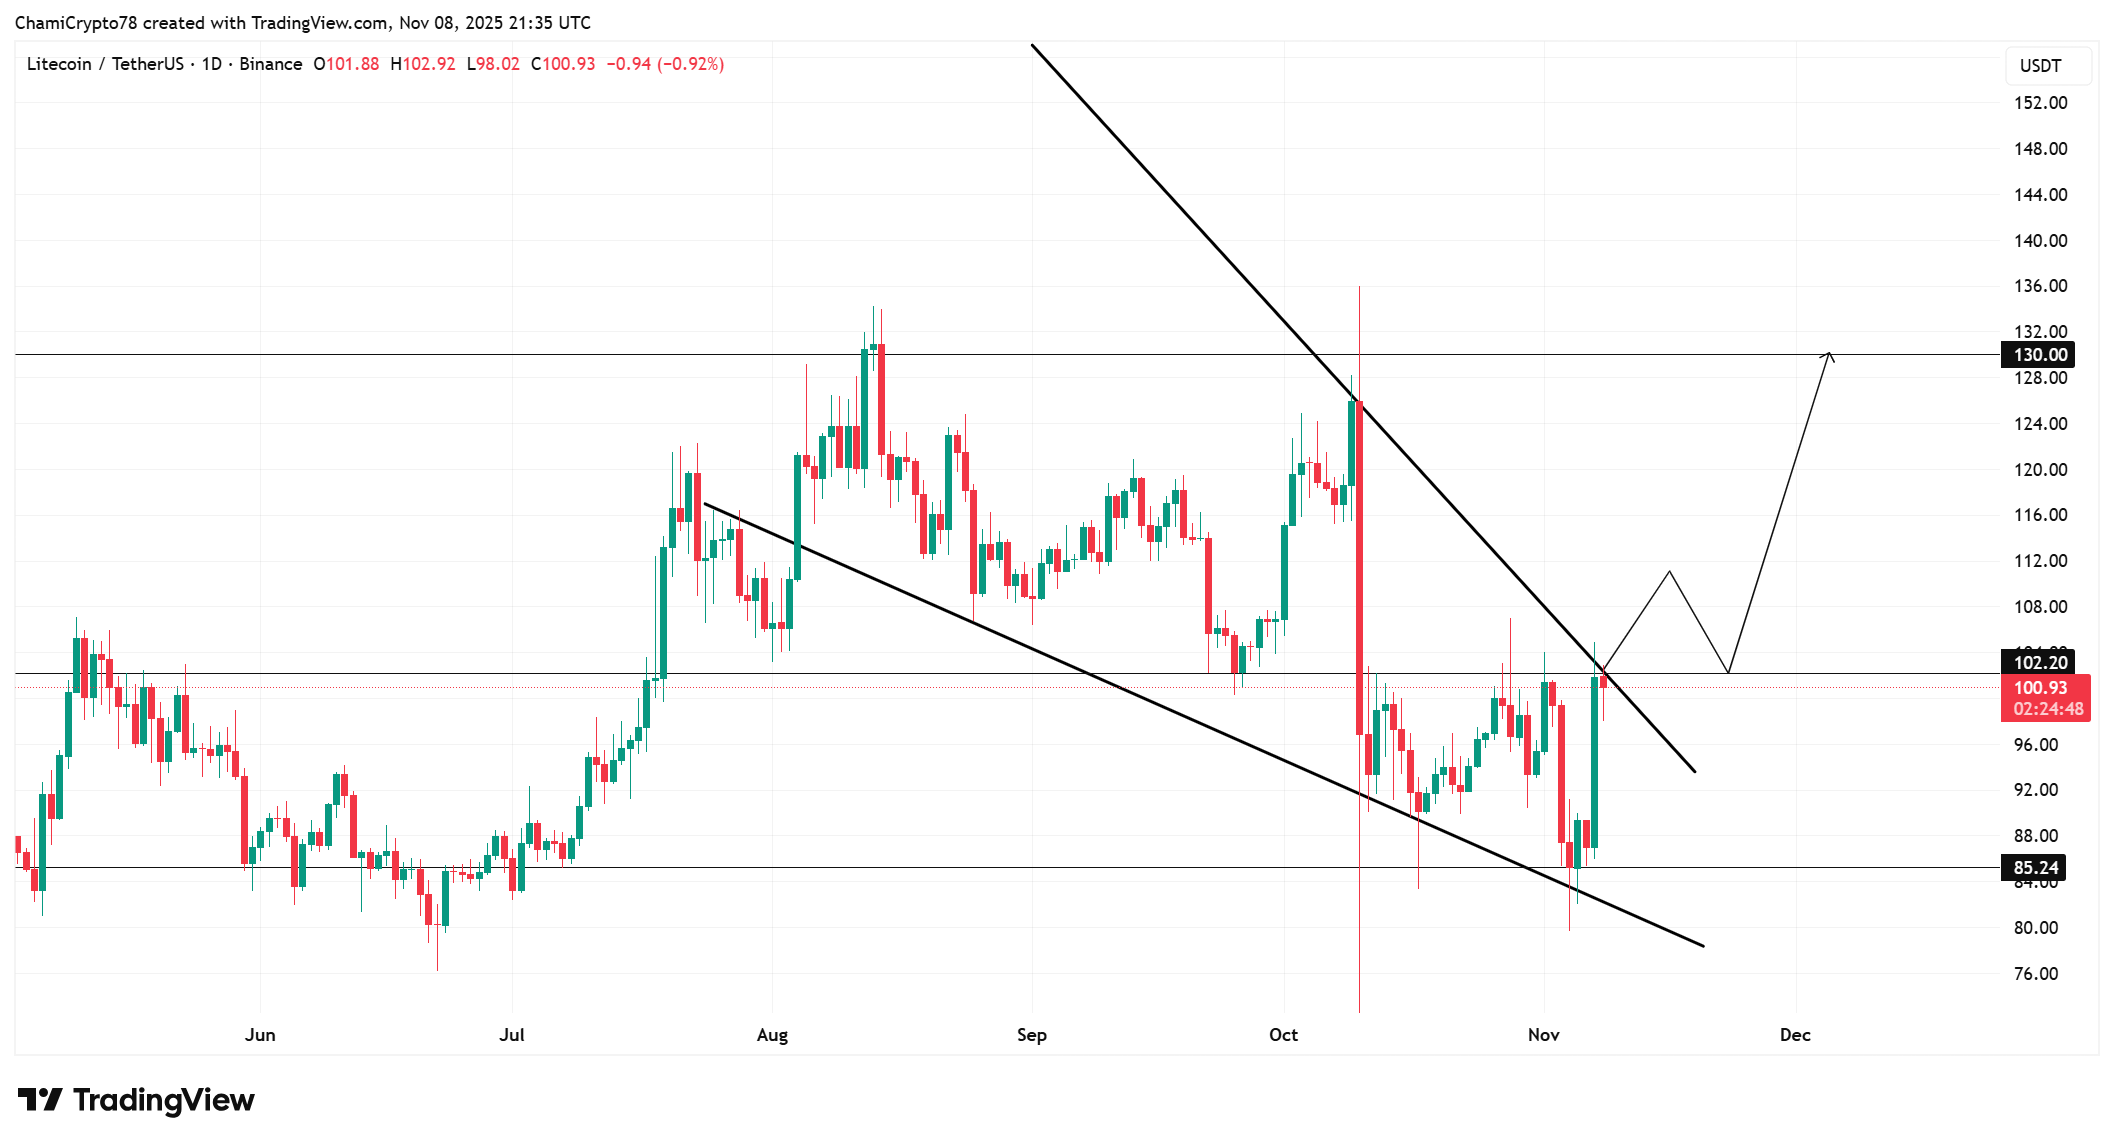
The LTC price is approaching a critical turning point after rebounding sharply from its lower support line. The current Litecoin value sits at $101.02, just under the decisive $102 resistance level that could define Litecoin’s near-term trajectory.
A breakout above this barrier would confirm a bullish reversal, targeting a potential rise toward $130 in the coming weeks. This move aligns with the structure of a falling wedge pattern visible on the chart, where the price has been compressing for several months.
Failure to close above $102, however, could trigger a retest of lower support around $85 before a renewed push higher. Overall, the technical landscape suggests that a confirmed close beyond resistance could reestablish a strong upward trend as Litecoin price prepares for its next expansion phase.
DMI And MACD Indicators Reinforce Bullish Outlook
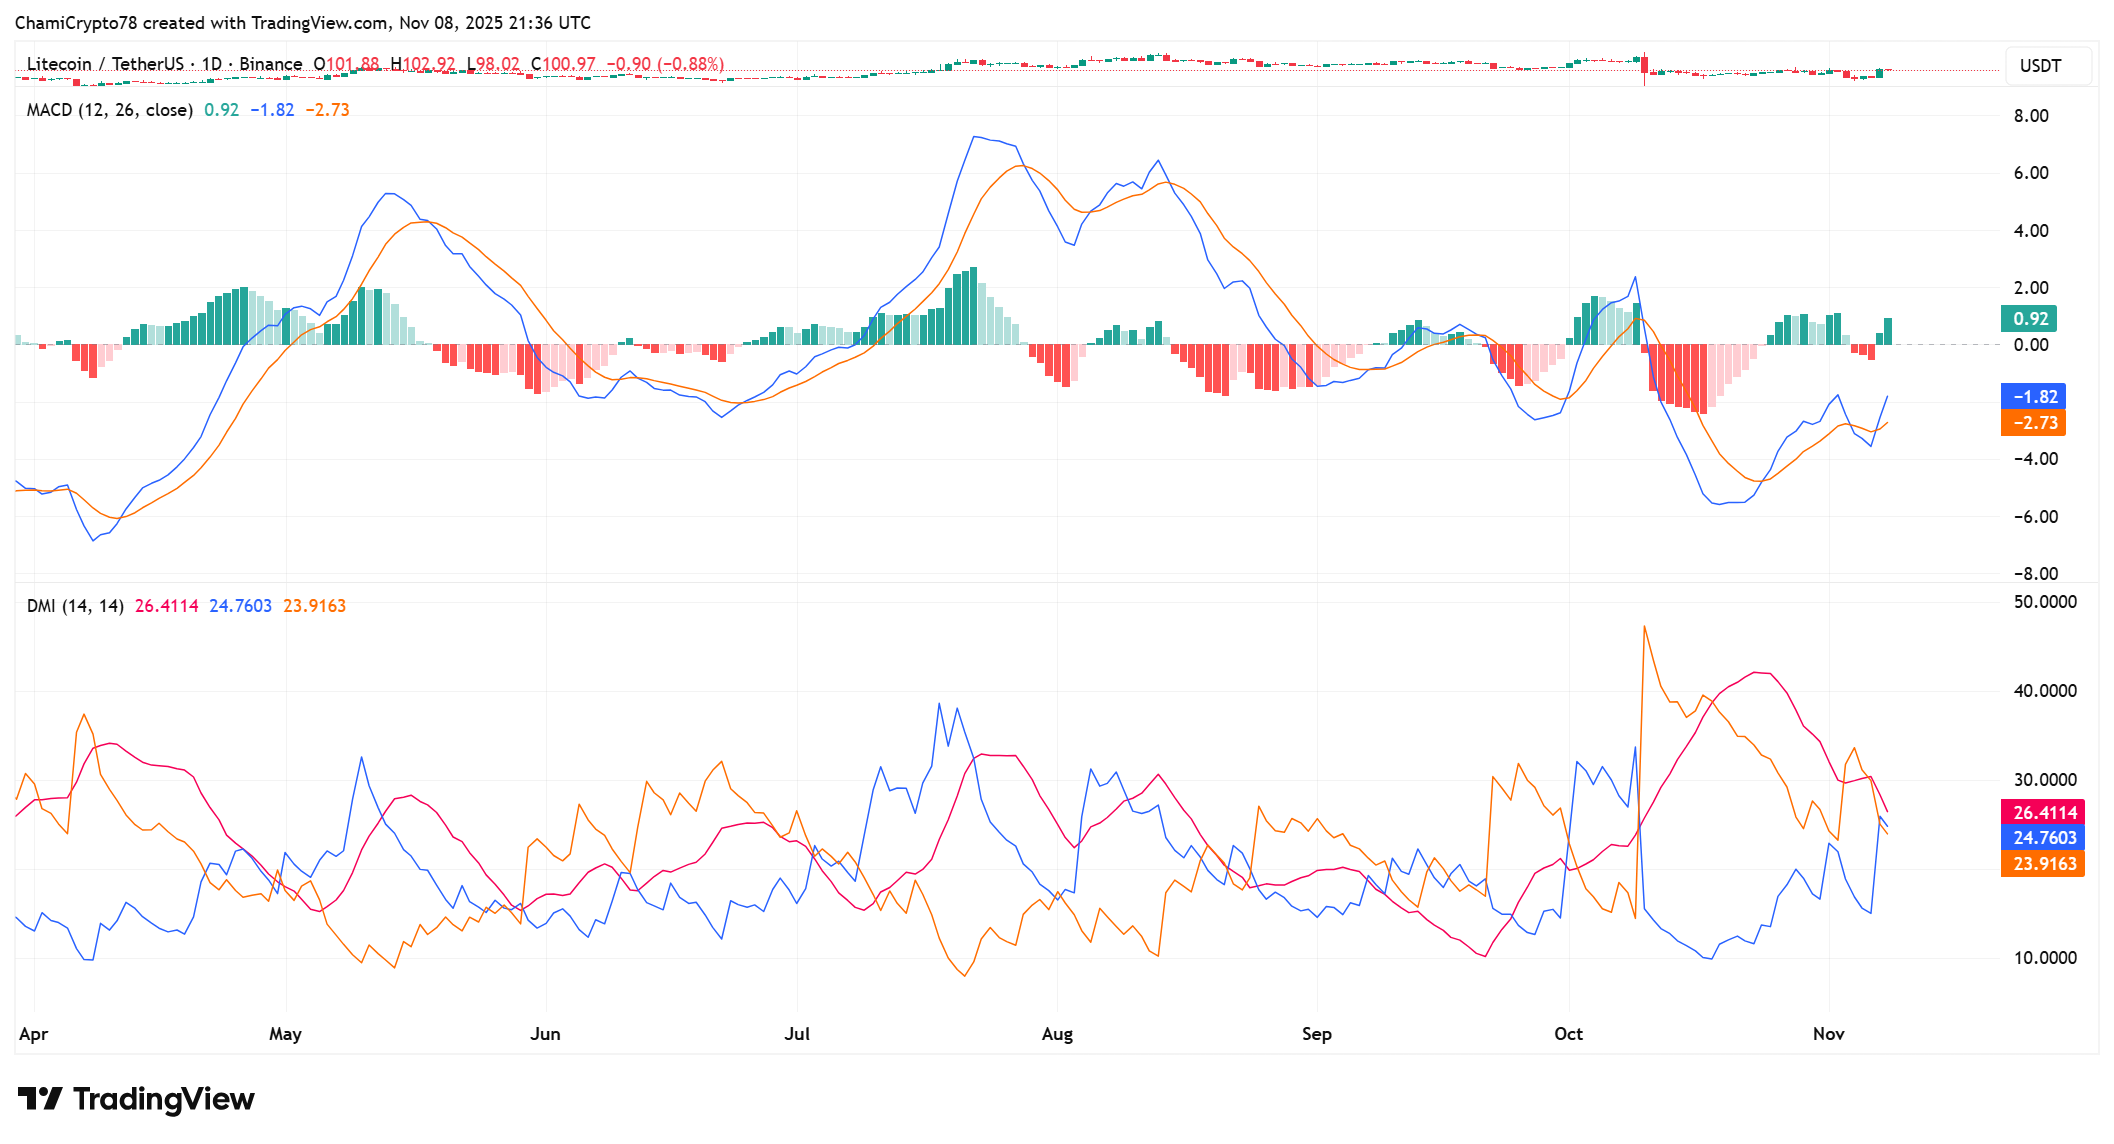
The DMI indicator highlights growing strength in Litecoin’s long-term price outlook, signaling a potential continuation of the recent uptrend. The +DI line currently sits at 24.76, while the -DI line trails lower at 21.92, suggesting buyers are steadily regaining control.
Meanwhile, the ADX reading at 26.41 indicates that the developing trend is gaining traction and could intensify with a sustained close above the $102 level. Complementing this, the MACD line has crossed above the signal line, confirming a bullish momentum shift that aligns with the strengthening DMI structure.
This dual confirmation reflects improving market conviction and reduced selling pressure, reinforcing Litecoin’s bullish setup. As buyers maintain dominance, the LTC price could extend its climb toward $130, validating the breakout structure and confirming a long-term LTC bullish cycle.
Profit Taking Continues But Bulls Hold Their Ground Firmly
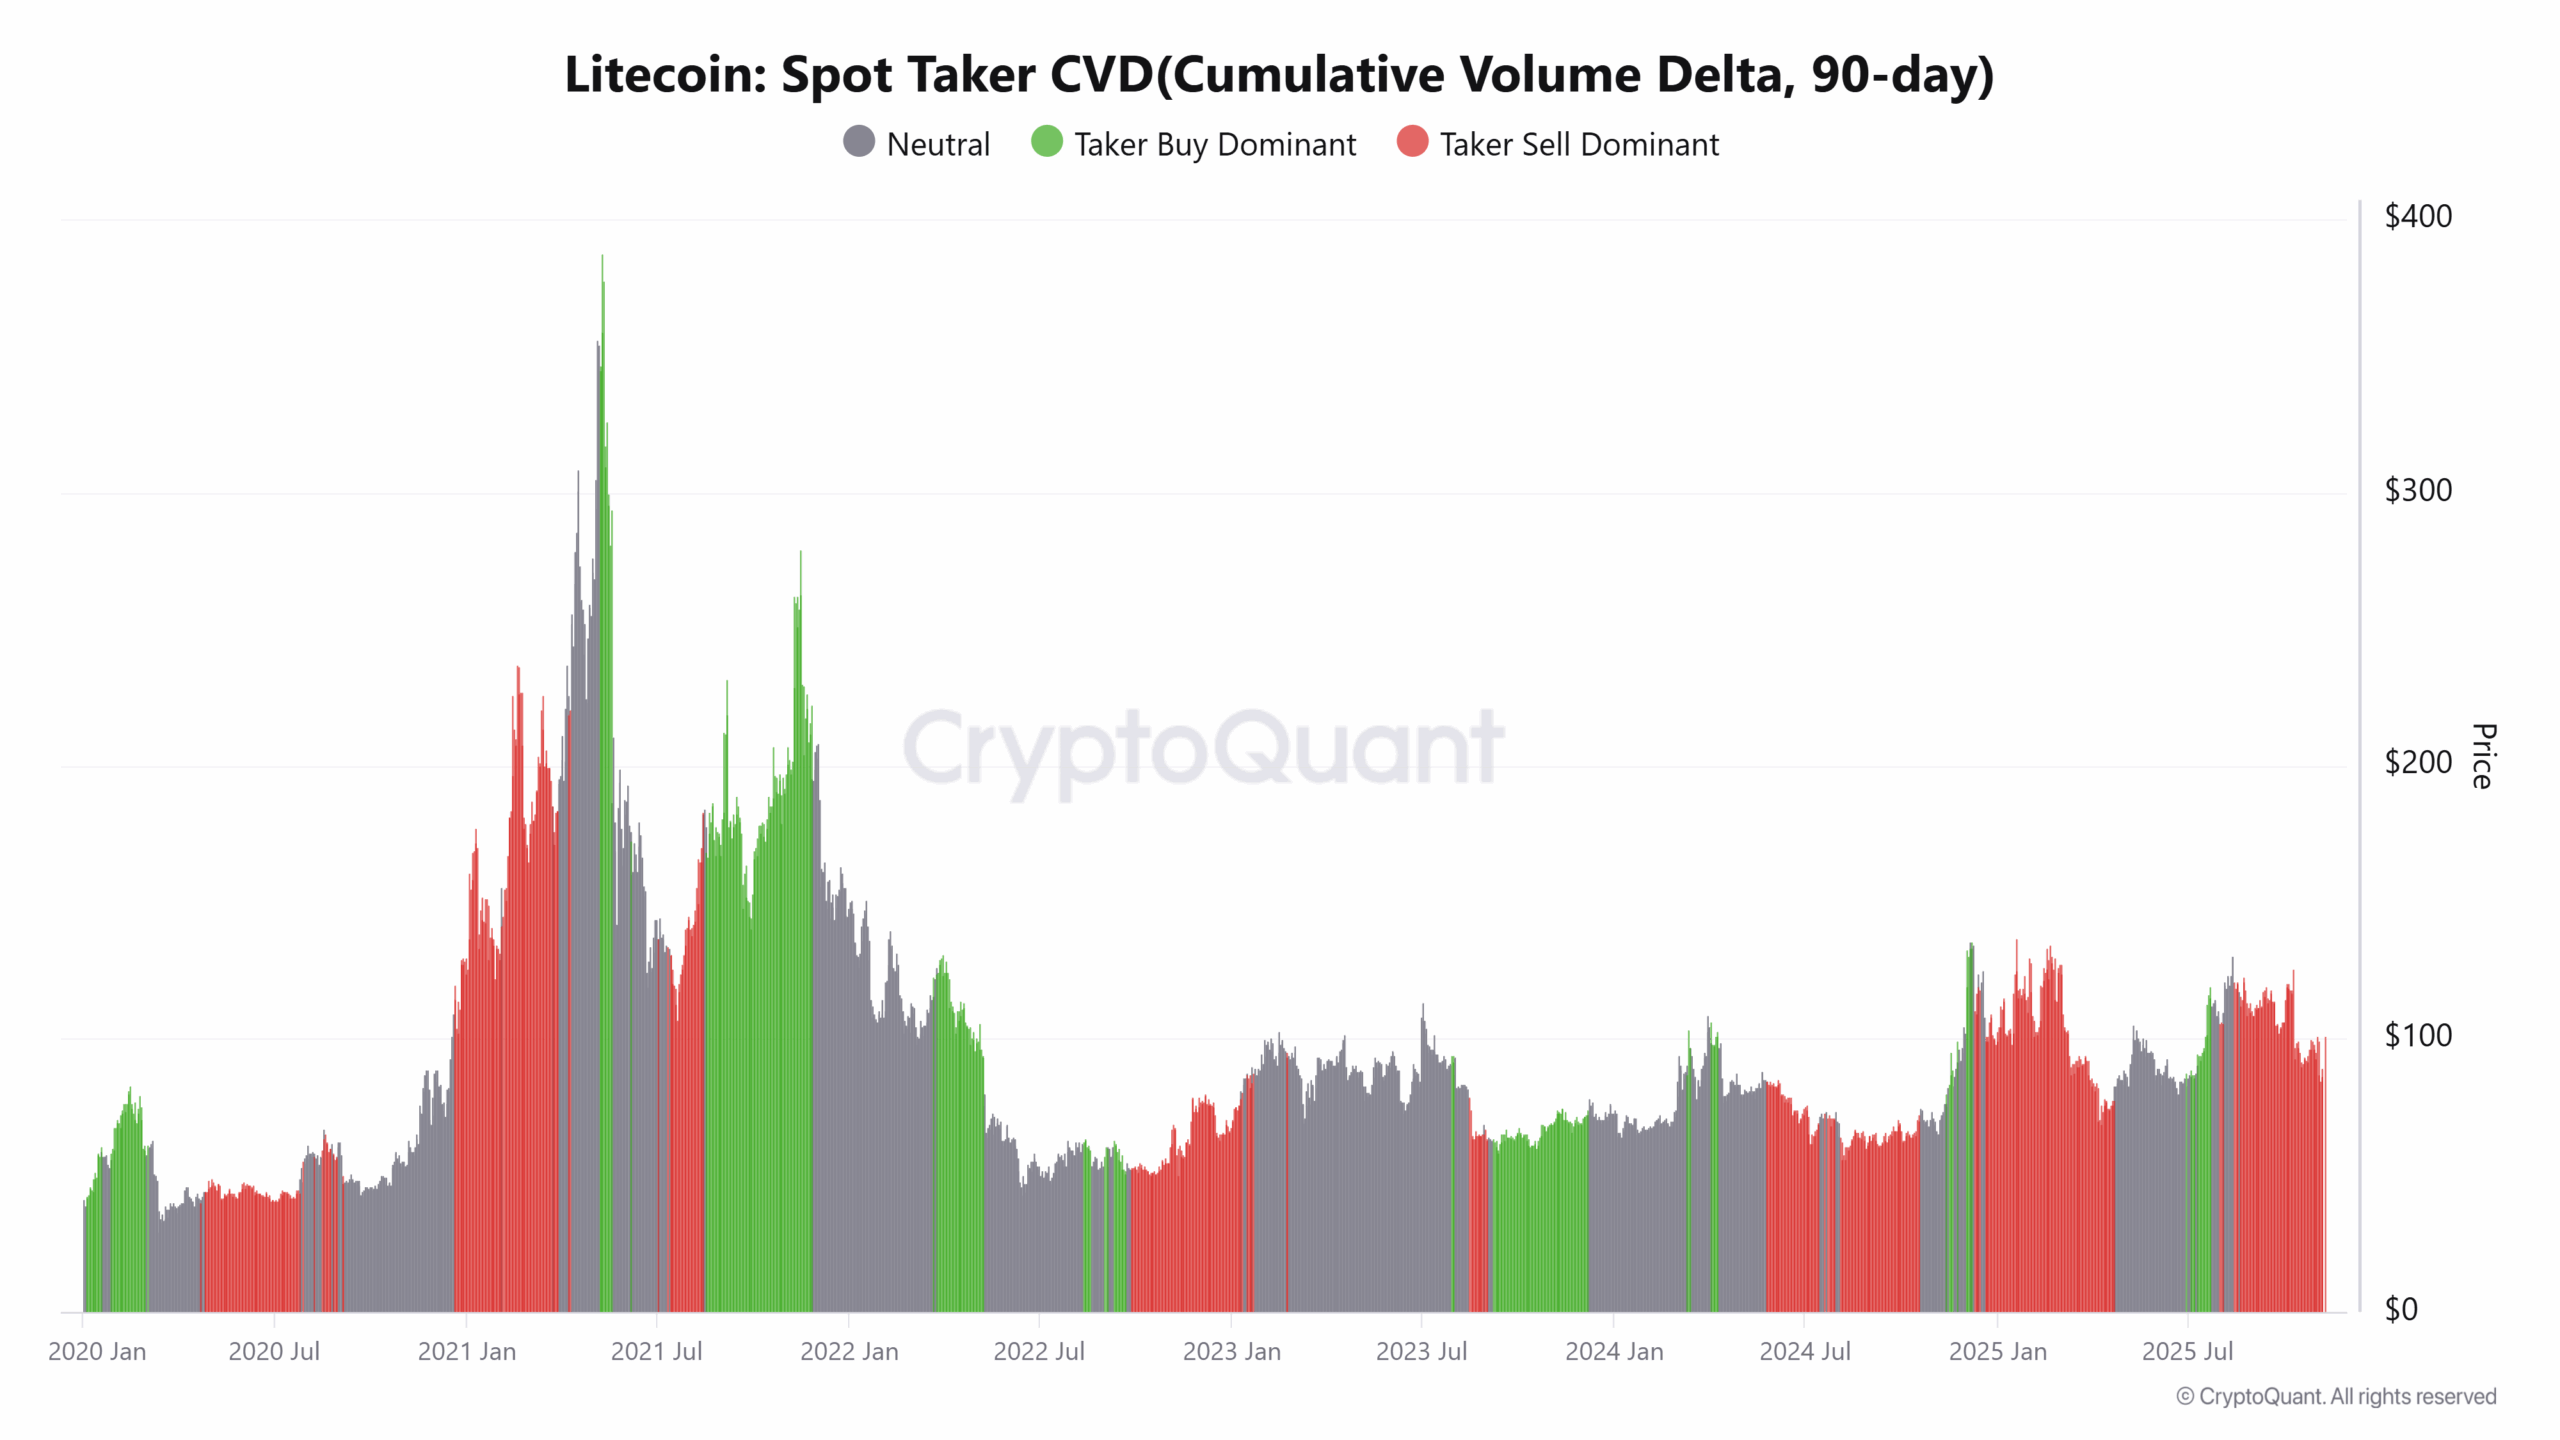
The Spot Taker CVD metric currently shows a clear Taker-Sell dominance, reflecting that sellers are slightly more active than buyers in recent sessions. However, this sell pressure mainly stems from profit-taking behavior rather than broad market weakness.
Despite this, the Litecoin price has remained resilient, hovering near the key $102 resistance zone without showing any meaningful downside reaction. This stability indicates that underlying buy orders continue to absorb most sell volume, keeping the short-term structure intact.
The profit-taking activity has therefore not yet influenced price direction, as Litecoin price continues to consolidate near a pivotal breakout point.
Adding to the optimism, the recently approved Canary Litecoin ETFs are set to begin trading on NASDAQ, reinforcing growing institutional interest in LTC. Therefore, if this buying base holds steady, the ongoing sell activity may instead serve as a healthy consolidation phase before Litecoin’s next advance toward $130.
To conclude, Litecoin price remains firmly positioned for an upward continuation after its 17% rally. Sustained buying interest near $102 confirms strong market conviction, signaling that bulls are in control. The broader structure now points toward an advance to the $130 zone as technical indicators align with growing institutional confidence. Overall, Litecoin’s recovery appears intact, with momentum favoring a decisive bullish continuation.
Frequently Asked Questions (FAQs)
1. What role do the DMI and MACD indicators play in Litecoin’s outlook?
2. Why hasn’t sell activity affected Litecoin’s upward movement?
3. How could the Canary Litecoin ETFs impact market sentiment?

Why Trust CoinGape
CoinGape has covered the cryptocurrency industry since 2017, aiming to provide informative insights Read more…to our readers. Our journal analysts bring years of experience in market analysis and blockchain technology to ensure factual accuracy and balanced reporting. By following our Editorial Policy, our writers verify every source, fact-check each story, rely on reputable sources, and attribute quotes and media correctly. We also follow a rigorous Review Methodology when evaluating exchanges and tools. From emerging blockchain projects and coin launches to industry events and technical developments, we cover all facets of the digital asset space with unwavering commitment to timely, relevant information.

Related Articles


- Ripple’s RLUSD Gets Institutional Boost as SEC Eases Stablecoin Rules for Broker-Dealers
- Crypto Market Weekly Recap: BTC Waver on Macro & Quantum Jitters, CLARITY Act Deadline Fuels Hope, Sui ETFs Go Live Feb 16-20
- Robert Kiyosaki Adds To Bitcoin Position Despite Market Decline
- XRP News: Ripple Partner SBI Reveals On-Chain Bonds That Pay Investors in XRP
- BitMine Ethereum Purchase: Tom Lee Doubles Down on ETH With $34.7M Fresh Buy
- XRP Price Prediction As SBI Introduces Tokenized Bonds With Crypto Rewards
- Ethereum Price Rises After SCOTUS Ruling: Here’s Why a Drop to $1,500 is Possible
- Will Pi Network Price See a Surge After the Mainnet Launch Anniversary?
- Bitcoin and XRP Price Prediction As White House Sets March 1st Deadline to Advance Clarity Act
- Top 3 Price Predictions Feb 2026 for Solana, Bitcoin, Pi Network as Odds of Trump Attacking Iran Rise
- Cardano Price Prediction Feb 2026 as Coinbase Accepts ADA as Loan Collateral


