Algorand Price Discounted 16% Amid Recent Sell-off; Buy This Dip Now?

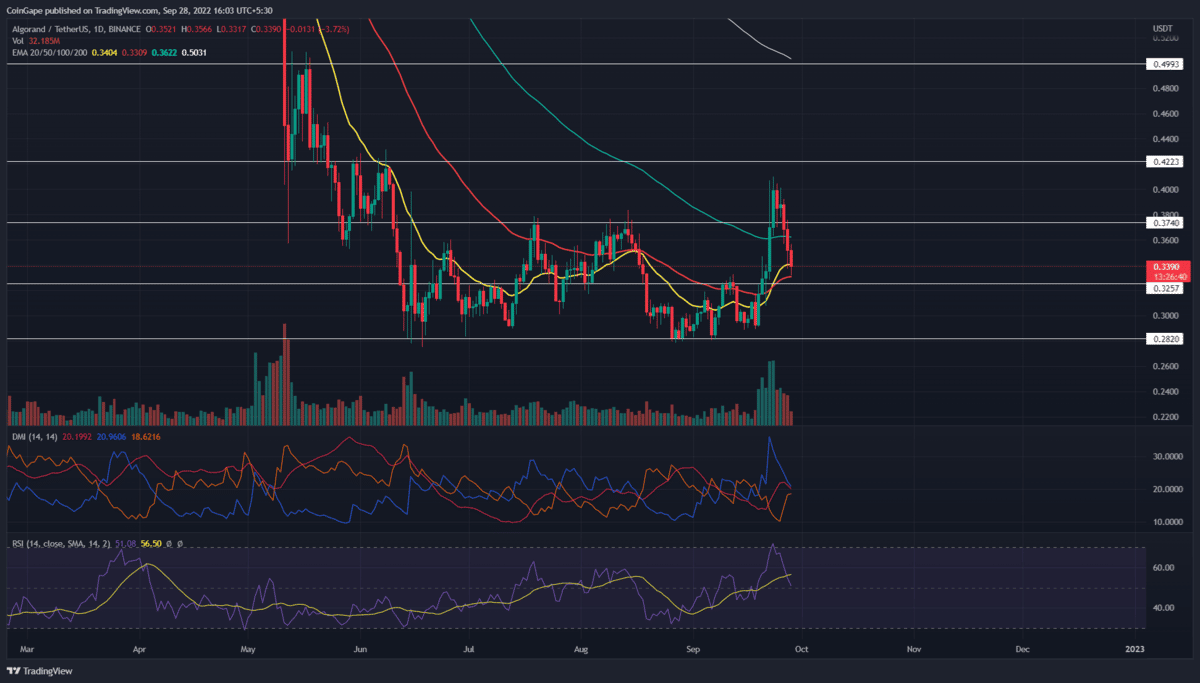
The Algorand price shows a sideways rally over the past three months. During this consolidation, the altcoin rebounded from this support multiple times, validating it as a strong accumulation zone. Furthermore, a recovery rally initiated from this support has witnessed a significant correction and plunged to $0.33 support. Thus, the coin chart displaying a recovery sign at this support should provide a good dip opportunity for traders.
Key points from Algorand price analysis:
- The ALGO holders can see a brighter future if the prices sustain above the 50-day EMA in the coming weeks.
- The long-wick daily candle projects high chances of a bullish reversal.
- The 24-hour trading volume in the Algorang coin is $195 Million, indicating a 5.87% gain.
 Source-Tradingview
The Algorand price action showcased a bullish reversal rally failing to sustain above the 100-day EMA due to the increased selling pressure at the $0.40 mark. The bullish failure leads to a price drop of 13% back under the 100-day EMA and the previous consolidation range.
The increase in the intraday trading volume supporting the bearish correction rally endangers the bullish dominance at the 50-day EMA.
However, the lower price rejection in the daily candle implies the correction as the retest to local support of $.33. Hence the price action analysis hints at a post-correction reversal.
The sideline buyers can find entry opportunities at the current prices due to this long-wick candle, taking support at the 50-day EMA, and the declining trend in the trading volume. The reversal rally can reach $0.37, where it will face double opposition from the 100-day EMA and the $0.37 resistance level, which can prove to be a solid roadblock.
Nonetheless, a more encouraging trend can give a bullish breakout entry, prolonging the uptrend to the $0.42 mark.
However, if reversal fails, the Algorand price could eventually lose the 50-day EMA and plummet price to $0.281.
Technical indicators:
DMI- The sharp fall in the Algorand price sabotages the bullish gap in the DI lines leading to a higher possibility of a bearish crossover.
RSI- The daily-RSI slope reverted from the overbought region and witnessed a significant downfall. This retracement indicates the prior aggressive buying has stabilized, and prices can continue their upward march.
- Resistance levels: $0.37 and $0.42
- Support levels: $0.33 and $0.28
- U.S. Government Shutdown Odds Hit 84%, Will Bitcoin Crash Again?
- Wall Street Giant Citi Shifts Fed Rate Cut Forecast To April After Strong U.S. Jobs Report
- XRP Community Day: Ripple CEO on XRP as the ‘North Star,’ CLARITY Act and Trillion-Dollar Crypto Company
- Denmark’s Danske Bank Reverses 8-Year Crypto Ban, Opens Doors to Bitcoin and Ethereum ETPs
- Breaking: $14T BlackRock To Venture Into DeFi On Uniswap, UNI Token Surges 28%
- Ethereum Price at Risk of a 30% Crash as Futures Open Interest Dive During the Crypto Winter
- Ethereum Price Prediction Ahead of Roadmap Upgrades and Hegota Launch
- BTC Price Prediction Ahead of US Jobs Report, CPI Data and U.S. Government Shutdown
- Ripple Price Prediction As Goldman Sachs Discloses Crypto Exposure Including XRP
- Bitcoin Price Analysis Ahead of US NFP Data, Inflation Report, White House Crypto Summit
- Ethereum Price Outlook As Vitalik Dumps ETH While Wall Street Accumulates


