Apecoin Price Analysis: Bearish RSI Divergence Hints Trend Reversal


The Apecoin price analysis hints at the price reversal in the offering. The price opened higher but could not sustain the gains and retrace lower. A long wick day’s red candlestick indicates the presence of the seller near the higher levels. As of writing, APE/USD is reading at $6.63, down 4.33% for the day.
- APE price turns negative following massive gains of 27% in two days.
- The bulls are facing rejection near the $7.19 level indicating weakness at a higher level.
- Negative divergence on the RSI signals more rounds of selling in the coin.
APE could move further lower
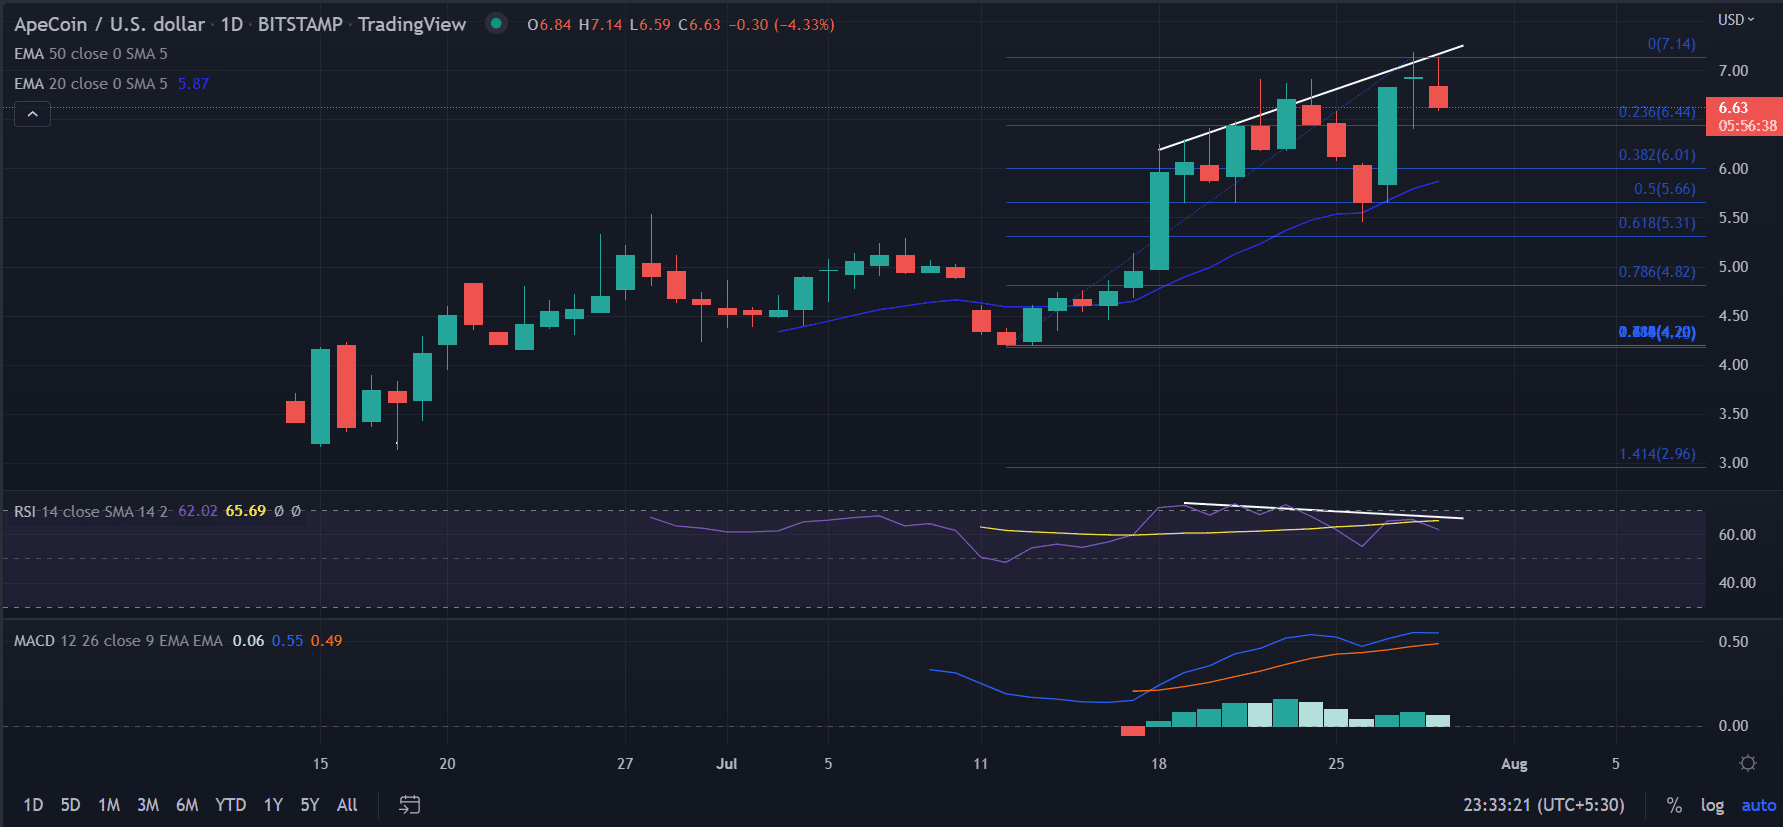
On the daily time frame, the Apecoin price analysis indicates a probable price correction, a healthy 0ne!
Currently, the price found support near the 0.23% Fibonacci retracement level that extends from the lows of $4.19. However, there is a higher chance of breaking the support and diving lower.
Firstly, the formation of a ‘Doji’ candlestick in the previous session, followed by a red candlestick. The formation is confirmation of a selling bias following an indecisive trading session.
Secondly, the bearish RSI divergence since July 19, pointing at a deeper correction toward the 0.38% Fibonacci retracement level placed at $6.02.
On the contrary, a move towards $6.85 would make bulls hopeful to retest $7.19.
4-hour chart hints down move
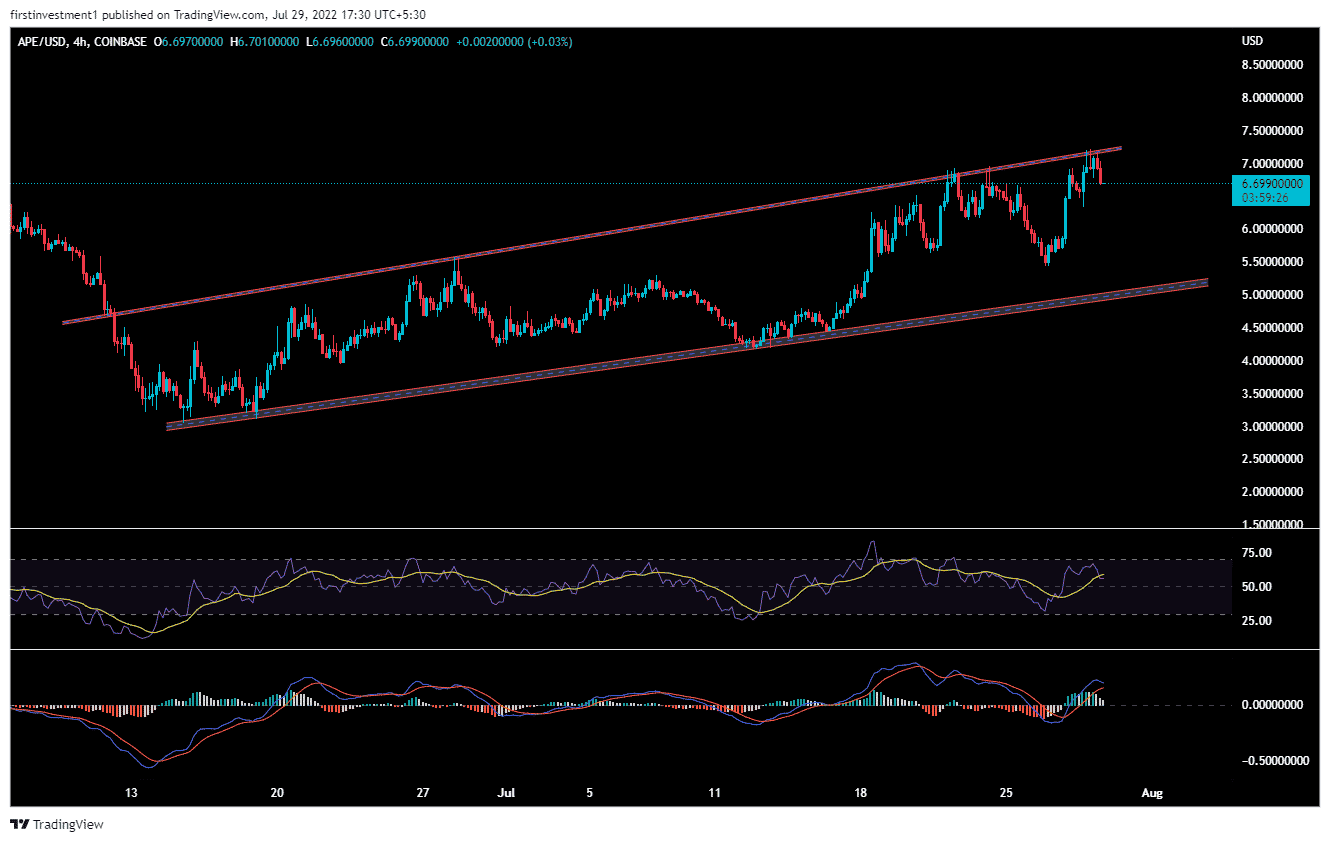
On the four-hour time frame, the Price is making higher highs and higher lows, indicating bullishness. But the structure on the higher side is now getting weak, making a double top. As a consequence, the distribution started at the crucial supply zone at around $7.19.
RSI as well as MACD is showing weakness in the four-hour time frame, indicating signs of reversal.
The market cap is above $ 2 billion, down 4.3% over the past 24 hours from CoinMarketCap data. During the price correction, trading volume continued to decline, suggesting less volatile and deep selling.

Why Trust CoinGape
CoinGape has covered the cryptocurrency industry since 2017, aiming to provide informative insights Read more…to our readers. Our journal analysts bring years of experience in market analysis and blockchain technology to ensure factual accuracy and balanced reporting. By following our Editorial Policy, our writers verify every source, fact-check each story, rely on reputable sources, and attribute quotes and media correctly. We also follow a rigorous Review Methodology when evaluating exchanges and tools. From emerging blockchain projects and coin launches to industry events and technical developments, we cover all facets of the digital asset space with unwavering commitment to timely, relevant information.

Related Articles


- CLARITY Act: Banks and Crypto Make Progress Following “Constructive” Dialogue at White House Meeting
- Expert Warns Bitcoin Bear Market Just In ‘Phase 1’ as Glassnode Flags BTC Demand Exhaustion
- SEC Chair Reveals Regulatory Roadmap for Crypto Securities Amid Wait for CLARITY Act
- ProShares Launches First GENIUS Act Focused Money Market ETF, Targeting Ripple, Tether, Circle
- BTC Price Falls as Initial Jobless Claims Come In Below Expectations
- Top 3 Price Predictions Feb 2026 for Solana, Bitcoin, Pi Network as Odds of Trump Attacking Iran Rise
- Cardano Price Prediction Feb 2026 as Coinbase Accepts ADA as Loan Collateral
- Ripple Prediction: Will Arizona XRP Reserve Boost Price?
- Dogecoin Price Eyes Recovery Above $0.15 as Coinbase Expands Crypto-Backed Loans
- BMNR Stock Outlook: BitMine Price Eyes Rebound Amid ARK Invest, BlackRock, Morgan Stanley Buying
- Why Shiba Inu Price Is Not Rising?


