Apecoin Price Analysis: Rising Supply Pressure May Tumble APE By 17%

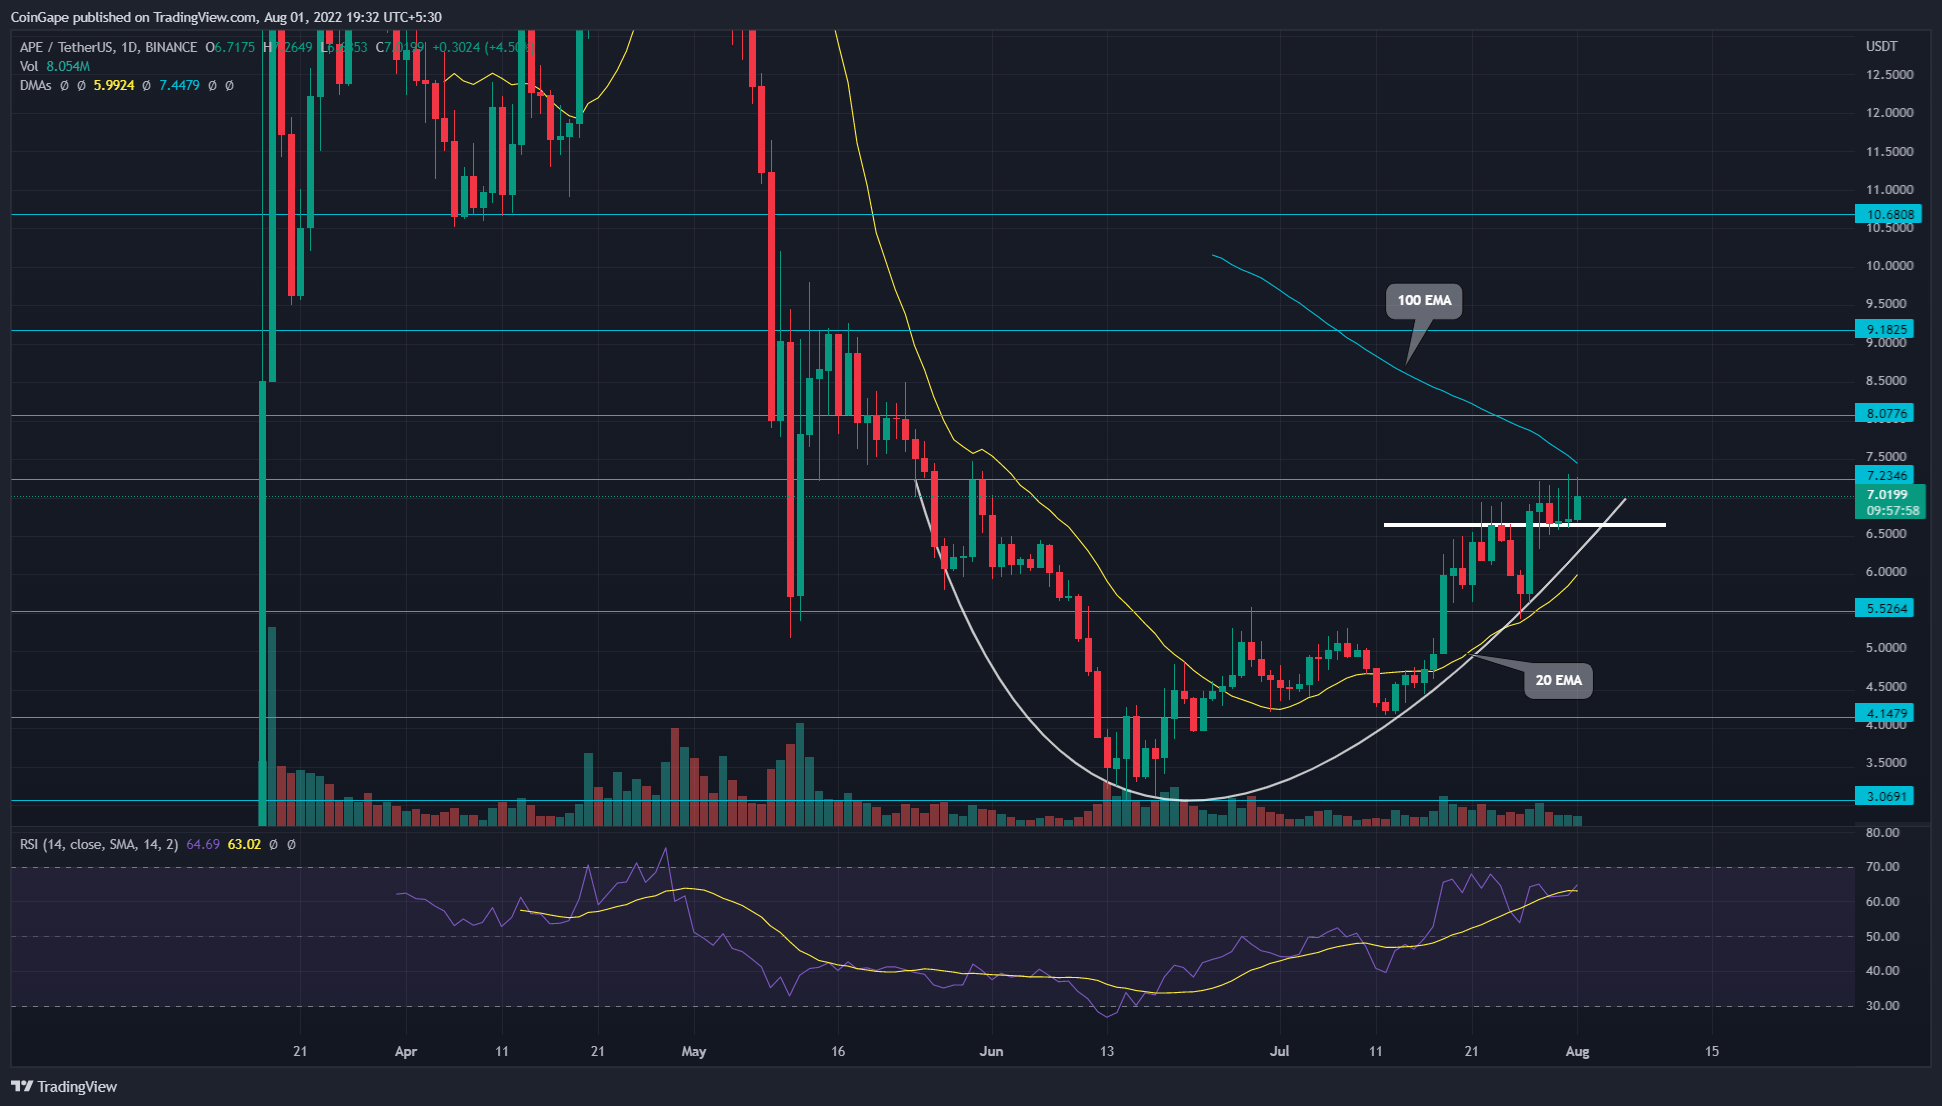
The ongoing recovery rally in APE price stalled at $7.23 resistance. Despite showcasing several attempts to breach this barrier, the buyers couldn’t surpass the $7.23 mark in the past four days. Even today, the coin price is 3.75% up, but the long rejection attached to it indicates another failed attempt from buyers.
Key points:
- The $7.23 breakout would trigger a directional rally in APE
- A breakdown below $5.52 would imply weakness in buyers’ commitment
- The intraday trading volume in the APE is $575.5 Million, indicating a 53.4% gain
 Source- Tradingview
The APE/USDT downfall took a complete turnaround after the price hit a $3.09 low. Amidst the improving market sentiment, the price action knocked out multiple resistance levels and showed a constant rally since last month.
On July 28, the bull-run tagged the $7.23 mark, registering a 138% growth since the mentioned low. However, the APE price showed several attempts to breach the overhead resistance, but all ended with long-wick rejection candles.
These failed trials hint the bullish momentum is exhausted, and the price may witness a significant correction before resuming the recovery rally. Furthermore, the price action shows a minor support level at the $6.63 mark, indicating a narrow consolidation.
Therefore, the daily candlestick closing beyond either barrier of the constitution will determine further movement in APE price.
Thus, if the sellers pull the altcoin below the $6.63 support, the traders may witness a 17% correction to the $5.52 support. However, losing this support would indicate weakness in bullish momentum, leading to further downfall to the $4.14 mark.
On the other hand, a candle closing above the $7.23 resistance will offer another breakout opportunity to buyers with a 26.7% higher target of $9.18.
Technical indicator
EMAs- The downsloping 100 DMA line is nearing to APE price would add additional selling pressure on traders. On the flip side, the short-term recovery is led by the dynamic support of the 20 DMA.
RSI indicator– a slight bearish divergence in RSI slope concerning the new higher high in price supports the pullback theory.
- Resistance levels- $7.23 and $8
- Support levels- $6.63 and $5.2
- Fed Rate Cut Uncertainty Mounts as BLS Delays Jobs Report Amid Shutdown
- Trump Tariffs: U.S. And India Reach Trade Deal, Crypto Market Recovers
- Is Kevin Warsh’s Fed Chair Nomination Bullish or Bearish for Bitcoin?
- U.S. ISM PMI Hits 4-Year High Above 52%, BTC Price Climbs
- Hyperliquid Unveils ‘HIP-4’ for Prediction Markets, HYPE Price Surges
- Top 3 Meme coin Price Prediction: Dogecoin, Shiba Inu And MemeCore Ahead of Market Recovery
- Here’s Why Pi Network Price Just Hit an All-Time Low
- Crypto Events to Watch This Week: Will the Market Recover or Crash More?
- XRP and BTC Price Prediction if Michael Saylor Dumps Bitcoin Following Crypto Market Crash
- Here’s Why MSTR Stock Price Could Explode in February 2026
- Bitcoin and XRP Price Prediction After U.S. Government Shuts Down


