Apecoin Price Breaks $5.7 Barrier For A 14% Rally, But What Next?


Following the May-June downtrend, the Apecoin price started walking a lateral path. Moreover, the altcoin resonating within two converging trendlines indicated the formation of an inverted pennant pattern. This symmetrical triangle-type consolidation shows a short break period for coin sellers before they continue the prevailing downtrend.
Key points from Apecoin price analysis:
- The APE price wobbling within a symmetrical triangle pattern will soon enter a no-trading zone
- The 20 and 50 EMA closing a bullish crossover in the daily timeframe chart
- The intraday trading volume in Apecoin is $385.2 Million, indicating a 36% loss
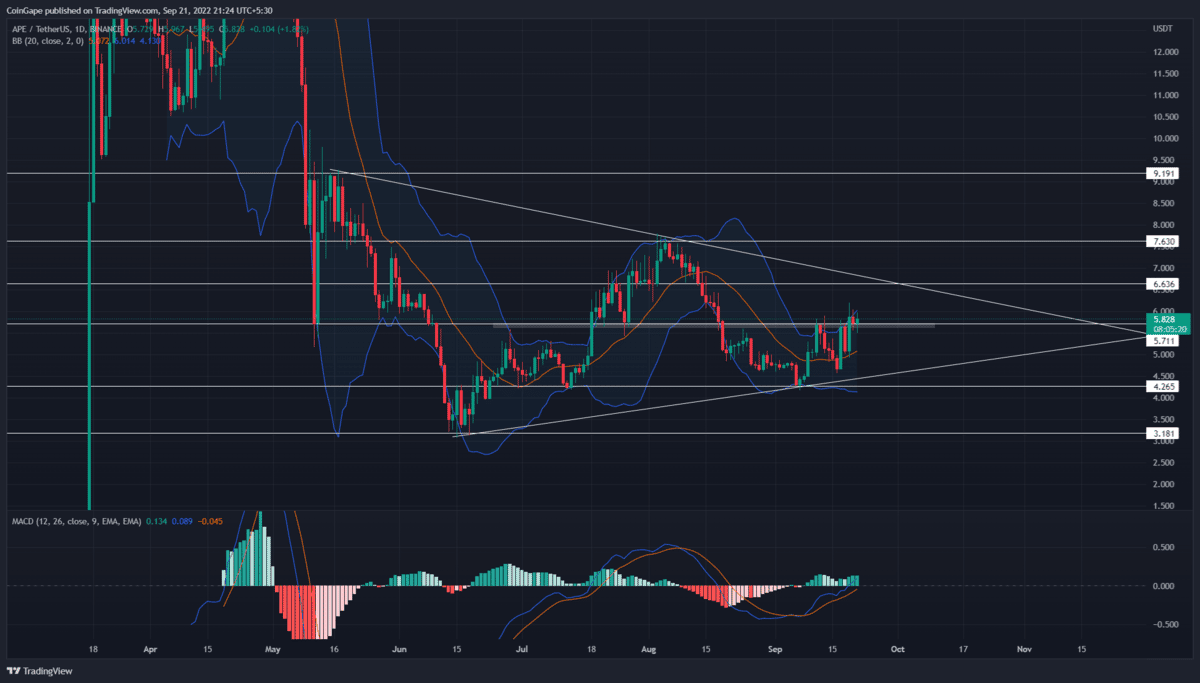
 Source- Tradingview
The ongoing bull cycle within this pattern was initiated when the prices rebounded from the support trendline on September 7th. However, after two weeks of struggles, the buyers have recently managed to breach the $5.6-$5.7 supply zone.
The coin chart showed two days of the retest phase in which the lower price rejection candle indicates a great entry opportunity. Thus, this flip support could increase the bullish momentum and drive the Apecoin price 14% higher to the shared resistance of $6.6 and a resistance trendline
Also read: Just-In: ApeCoin (APE) Community Gets Its Separate BAYC NFT Marketplace
Under the pattern’s influence, the Apecoin price will likely revert from the resistance trendline and make its way to the support trendline.
As per technical setup, a breakdown below the support trendline will trigger the inverted pennant pattern. Doing so will resume the prevailing downtrend, and at first, the potential downfall will drop to the June bottom support of $3.18.
On a contrary note, a triangle consolidation holds a possibility to breach the overhead trendline. If this theory worked out, the coin holders might witness a new recovery rally.
Technical Indicator
MACD indicator: with a significant gap, the fast and slow lines may soon enter bullish territory, boosting the buyer’s conscience in this recovery.
Bollinger band indicator: the coin price retesting the indicator’s upper band could stall the ongoing recovery or cause a minor retracement. However, until the prices sustain above the support trendline, the coin holder doesn’t have to panic.
- Resistance levels: $6.6 and $7.6
- Support levels: $5.7 and $5.1

Why Trust CoinGape
CoinGape has covered the cryptocurrency industry since 2017, aiming to provide informative insights Read more…to our readers. Our journal analysts bring years of experience in market analysis and blockchain technology to ensure factual accuracy and balanced reporting. By following our Editorial Policy, our writers verify every source, fact-check each story, rely on reputable sources, and attribute quotes and media correctly. We also follow a rigorous Review Methodology when evaluating exchanges and tools. From emerging blockchain projects and coin launches to industry events and technical developments, we cover all facets of the digital asset space with unwavering commitment to timely, relevant information.

Related Articles


- Bitcoin Quantum Threat: CryptoQuant’s CEO Flags Risk of Losing Satoshi’s 1M BTC Stash to Hackers
- Crypto Regulation: Hyperliquid Launches Policy Group to Push DeFi Integration in U.S. Markets
- XRP News: XRPL Activates Permissioned DEX Upgrade to Boost Institutional DeFi Adoption
- WLFI Token Sees 19% Spike Ahead of World Liberty’s Mar-a-Lago Forum Today
- Veteran Trader Peter Brandt Predicts Bitcoin Price Rebound, Gold Fall to $4000
- How XRP Price Will React as Franklin Templeton’s XRPZ ETF Gains Momentum
- Will Sui Price Rally Ahead of Grayscale’s $GSUI ETF Launch Tomorrow?
- Why Pi Network Price Could Skyrocket to $0.20 This Week
- Pi Network Price Beats Bitcoin, Ethereum, XRP as Upgrades and Potential CEX Listing Fuels Demand
- 5 Things Dogecoin Price Needs to Hit $0.20 in Feb 2026
- Bitcoin Price Prediction as Experts Warns of Quantum Risks


