 Buy $GGs
ASTER vs HYPE Price Analysis – Which Perp DEX Token Looks Poised to Dominate Q4 Performance?


Highlights
- ASTER price forms an inverse head-and-shoulders pattern, signaling potential breakout confirmation.
- HYPE price retests its demand zone, with support around $43 crucial for a rebound.
- ASTER stands a stronger chance of outperforming through Q4 based on current technical structure.
The ASTER price has slipped by 2.37% over the past 24 hours, while the HYPE price has dropped 7.78%, signaling short-term caution across both markets. Despite this decline, both tokens are displaying notable technical setups that could determine their Q4 performance. As both assets consolidate near key inflection points, market attention now shifts to which altcoin could close Q4 on a stronger note.
ASTER Price Builds Strength Through Inverse Head-And-Shoulders Pattern
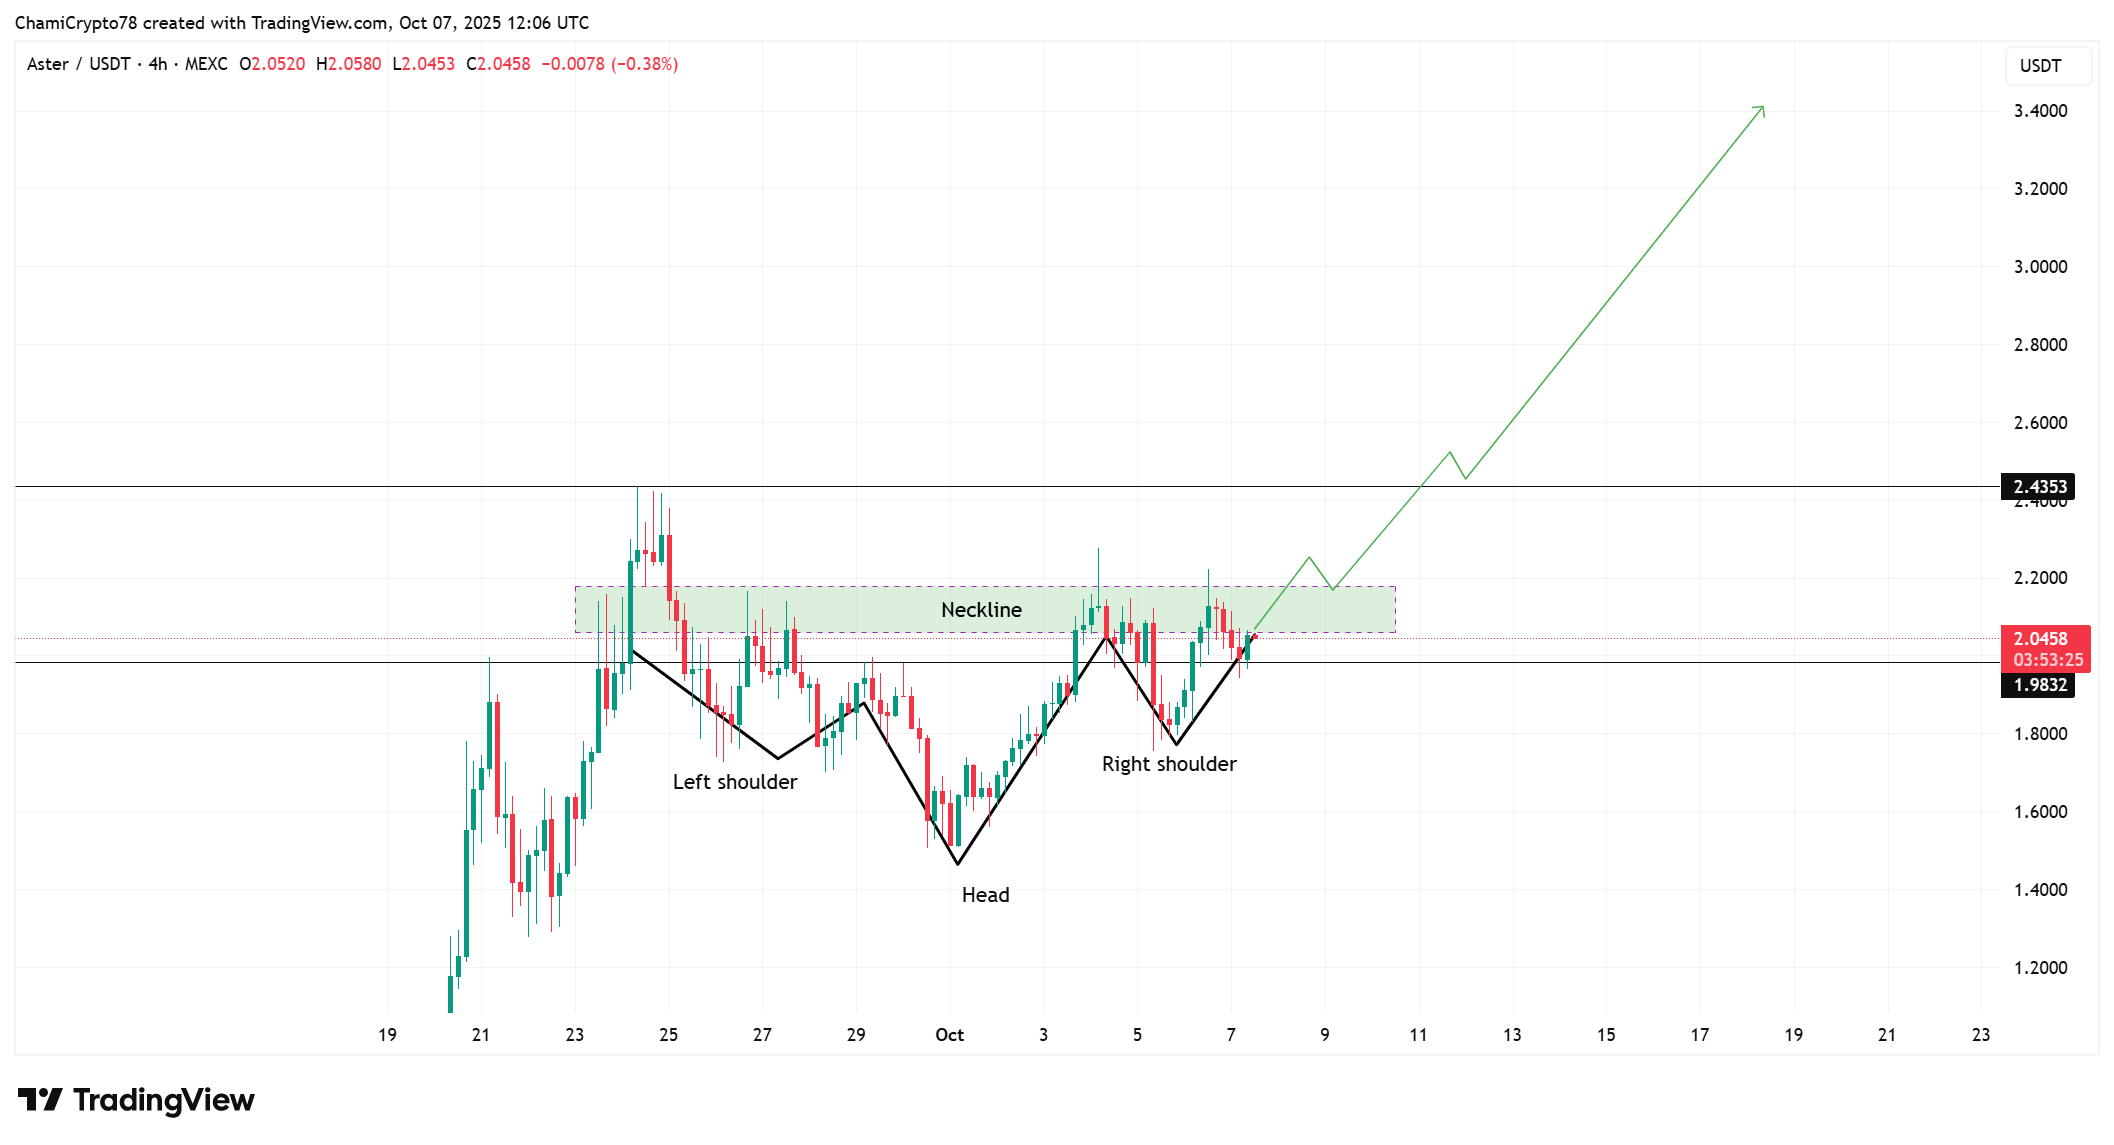
The ASTER price has been carving an inverse head-and-shoulders formation since late September, showing early signs of a bullish structural reversal. The left shoulder formed between September 21 and 24, when prices briefly dipped before finding short-term support.
The head developed between September 28 and October 5, establishing the lowest swing point around the $1.80 zone. Meanwhile, the right shoulder has taken shape over the past few days, showing steady accumulation above $1.95.
The current ASTER market price trades at around $2.03, positioning the token just below the neckline level and indicating a potential breakout attempt in the short term.
Specifically, the neckline sits around $2.15, and a decisive breakout above this threshold could open the path toward $2.43, which aligns with the next resistance zone. If ASTER fails to clear this neckline, it may retest $1.98 before regaining strength.
However, if buying pressure increases near the neckline, the ASTER price could accelerate toward $2.80 and even challenge the $3.00 level by late October.
CoinGape recently predicted that ASTER could reach the $3 mark following a channel breakout and rising Open Interest, further reinforcing the bullish case.
Therefore, the ongoing consolidation around the neckline remains the most critical phase for confirming the reversal. A sustained close above this level would signal a strong technical recovery through Q4.
HYPE Price Targets Key Support Amid Heavy Selling Pressure
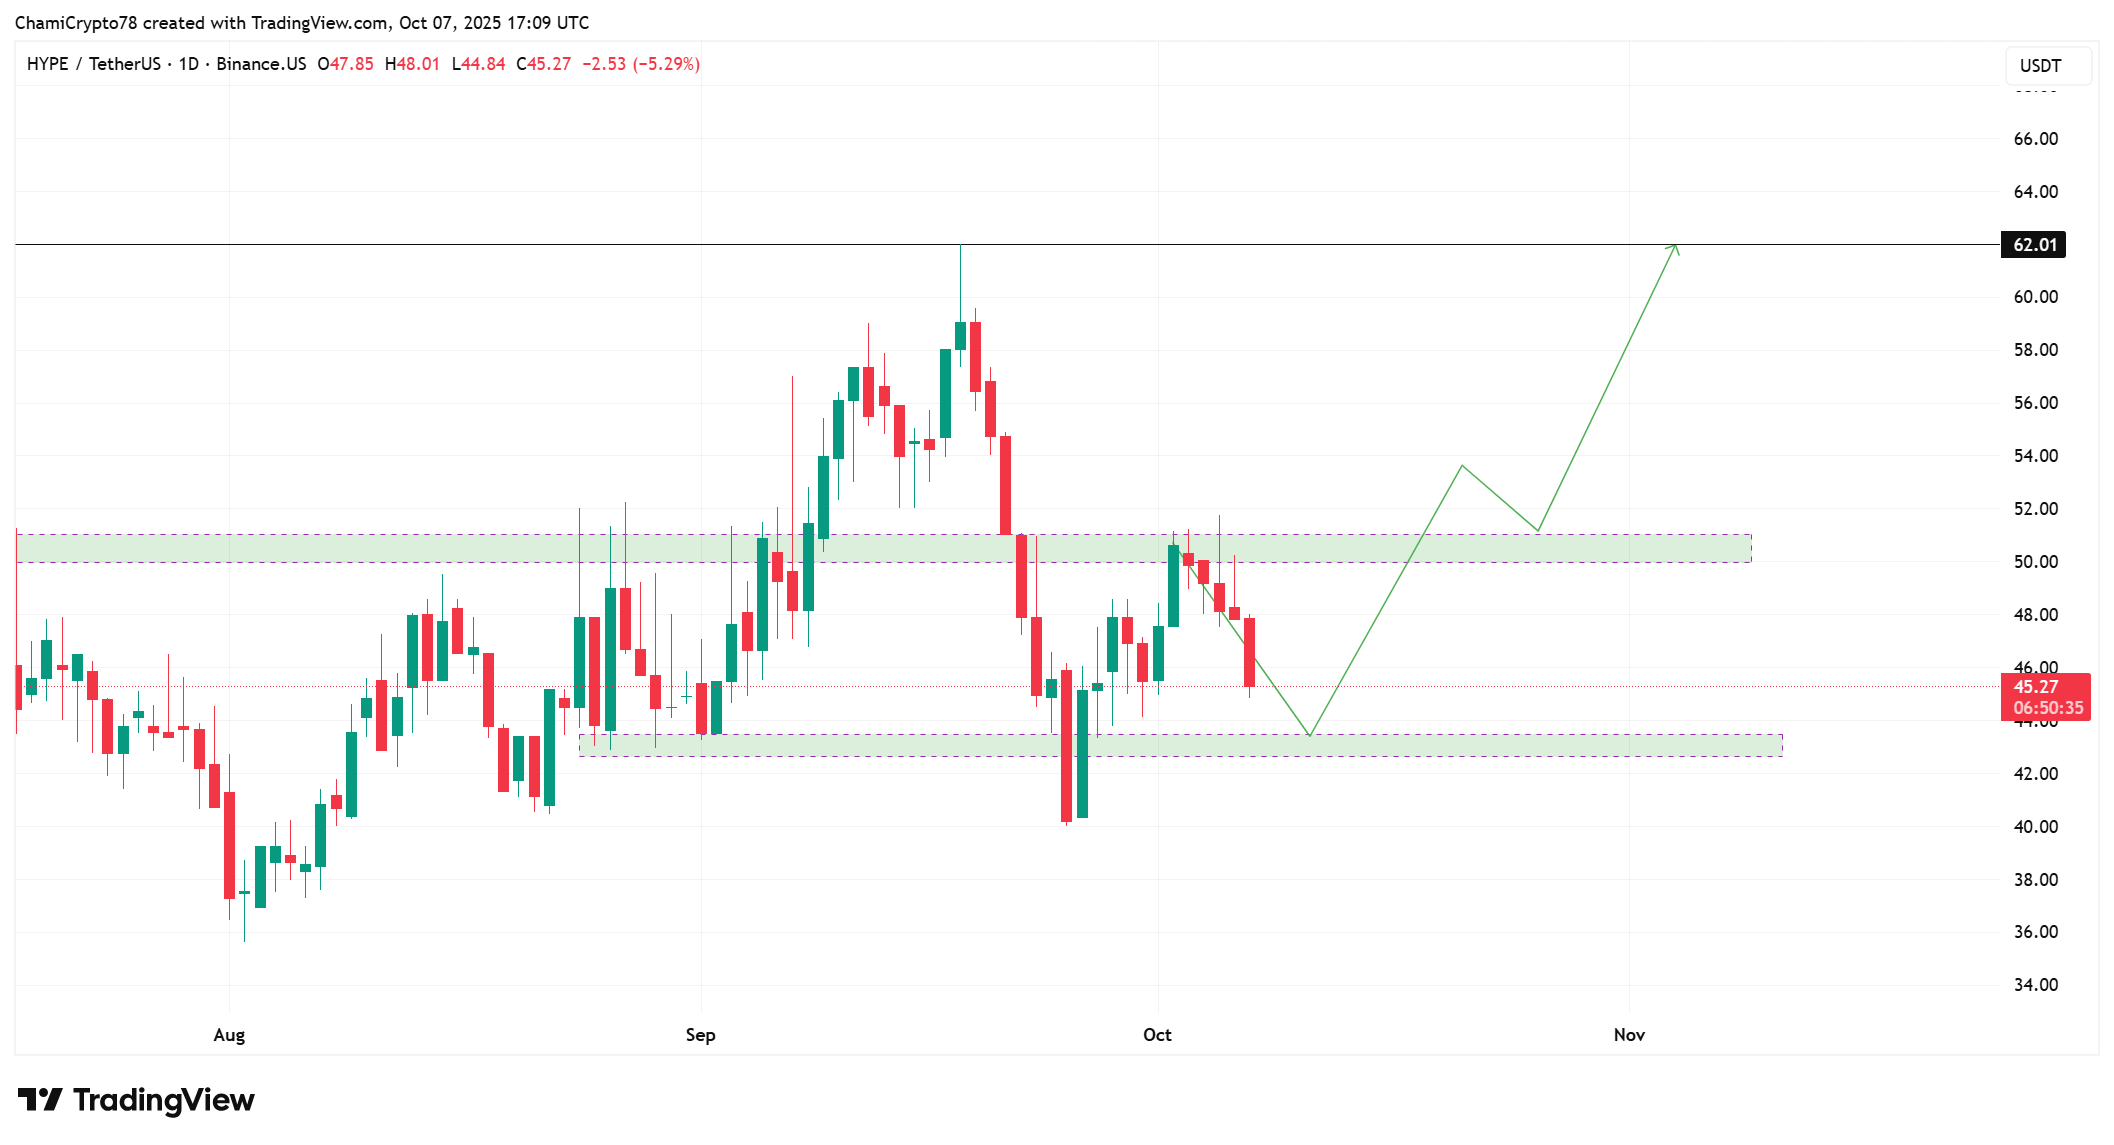
The HYPE price has been under strong selling pressure since early October, falling from the $54 resistance region toward the mid-$40 range. The current HYPE market price trades at approximately $45, marking a 7.78% daily decline as the token revisits its lower demand zone.
This region between $42 and $44 coincides with the 0.236 Fibonacci retracement level, which historically attracted short-term buyers. A rebound from this zone could push HYPE back toward $48 and later to $53, aligning with the 0.382 retracement and prior swing highs observed in late September.
If the demand zone holds, the HYPE price could reestablish short-term strength heading into mid-October. However, failure to sustain above $43 could trigger a deeper pullback toward $40, invalidating the bullish recovery scenario.
A breach below that level may expose HYPE to extended consolidation before fresh accumulation returns. Meanwhile, reclaiming $48 would be a critical signal for renewed buyer control, likely reigniting optimism for a rebound into the second half of Q4.
Trader James Wynn recently commented that Hyperliquid could face a gradual decline in the coming months, citing concerns over its competitive positioning and trading activity. He believes the DEX may experience slower growth compared to rivals unless it secures stronger liquidity inflows before year-end
Considering the broader structure, the long-term HYPE price prediction remains cautiously optimistic, contingent on the $43 zone holding firm and confirming a recovery base before the next leg up.
Summary
Both ASTER and HYPE are navigating crucial technical structures that will likely define their Q4 outcomes. ASTER’s inverse head-and-shoulders formation signals growing potential for a confirmed breakout if neckline resistance is breached. In contrast, HYPE’s recovery depends heavily on the integrity of its demand zone around $43. If that level holds, short-term relief could emerge, but the structure remains weaker than ASTER’s. Therefore, ASTER stands a stronger chance of outperforming through Q4 as its bullish setup matures.
Play 10,000+ Casino Games at BC Game with Ease
- Instant Deposits And Withdrawals
- Crypto Casino And Sports Betting
- Exclusive Bonuses And Rewards

Frequently Asked Questions (FAQs)
1. What chart pattern is forming on the ASTER price chart?
2. Why is the demand zone important for HYPE?
3. How does technical structure favor ASTER in Q4?

Why Trust CoinGape
CoinGape has covered the cryptocurrency industry since 2017, aiming to provide informative insights Read more…to our readers. Our journal analysts bring years of experience in market analysis and blockchain technology to ensure factual accuracy and balanced reporting. By following our Editorial Policy, our writers verify every source, fact-check each story, rely on reputable sources, and attribute quotes and media correctly. We also follow a rigorous Review Methodology when evaluating exchanges and tools. From emerging blockchain projects and coin launches to industry events and technical developments, we cover all facets of the digital asset space with unwavering commitment to timely, relevant information.

Related Articles


- Breaking: Morgan Stanley Applies For Crypto-Focused National Trust Bank With OCC
- Ripple Could Gain Access to U.S. Banking System as OCC Expands Trust Bank Services
- $2T Barclays Explores Blockchain For Stablecoin Payments and Tokenized Deposits
- Breaking: U.S. PPI Inflation Rises To 2.9%, BTC Price Falls
- XRP News: Ripple-Backed Ctrl Alt Completes $280M in Diamond Tokenization on XRPL
- Top Analyst Predicts Pi Network Price Bottom, Flags Key Catalysts
- Will Ethereum Price Hold $1,900 Level After Five Weeks of $563M ETF Selling?
- Top 2 Price Predictions Ethereum and Solana Ahead of March 1 Clarity Act Stablecoin Deadline
- Pi Network Price Prediction Ahead of Protocol Upgrades Deadline on March 1
- XRP Price Outlook As Jane Street Lawsuit Sparks Shift in Morning Sell-Off Trend
- Dogecoin, Cardano, and Chainlink Price Prediction As Crypto Market Rebounds


