
Avalanche Coin Holds Recovery Opportunity With This Bullish Pattern


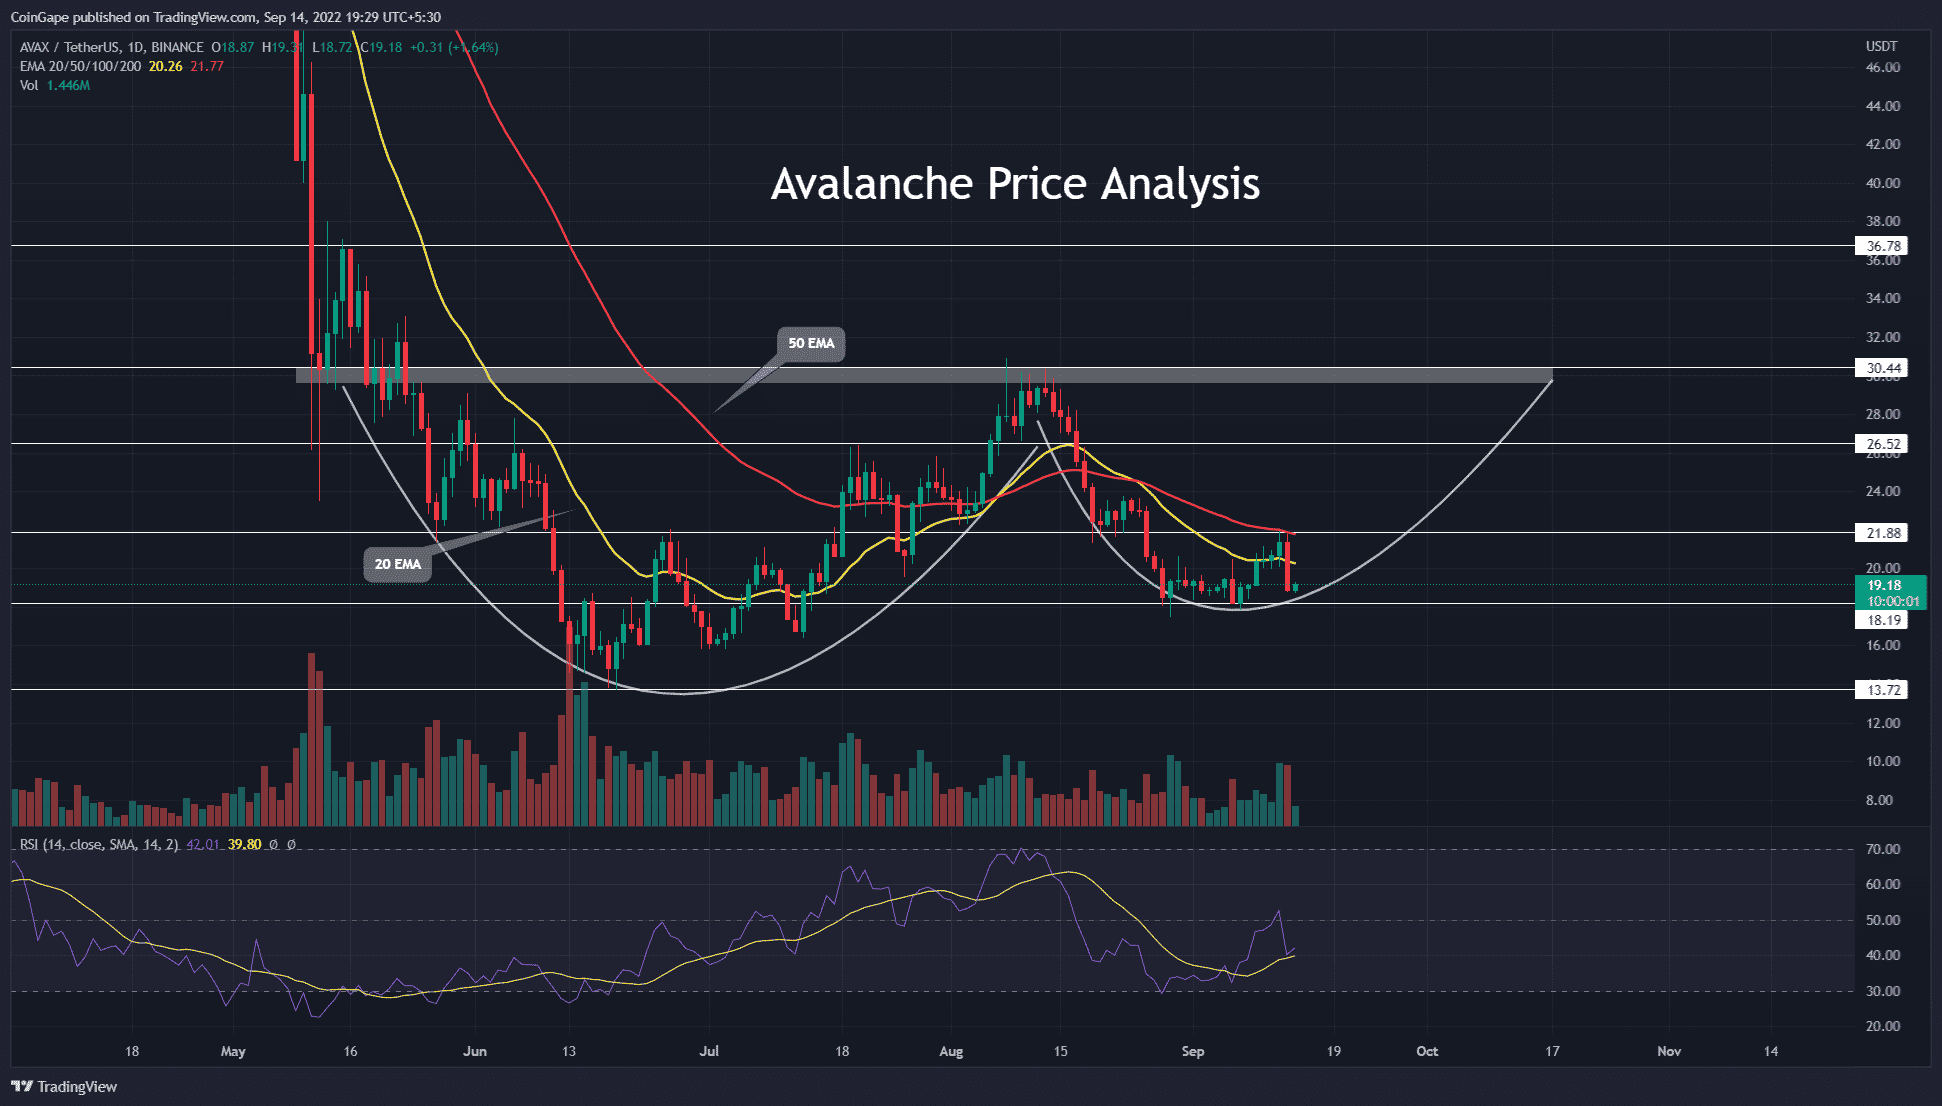
A V-top reversal from $30.5 resistance tumbled the Avalanche coin price to 0.786 Fibonacci retracement level at $18.2. The coin buyers obtained suitable floating at this level and triggered a 22% rally to $21.88. However, the recent sell-off in the crypto market offsets the AVAX price recovery and threatens further correction.
Key points from Avalanche:
- A bullish breakout from $21.8 will encourage the formation of the aforementioned bullish pattern
- The AVAX sellers reclaim the 20-day EMA slope
- The intraday trading volume in Avalanche coin is $479.2 Million, indicating a 38.5% loss.
Source- Tradingview
Concerning the June-July recovery and August correction, the daily time frame chart showed the formation of a cup and handle pattern. This bullish pattern, often located at the market bottom, gives an effective recovery opportunity upon execution. Thus, for the pattern completion, the Avalanche coin price should breach the neckline resistance of $30.5.
However, the Avalanche price recovery failed to rise above the $21.88 resistance due to the September 13th sell-off, weakening the possibility of pattern completion. Yesterday’s downfall was caused due to the high consumer price index(CPI) data.
Thus, the Avalanche coin price has dropped 12.37% from the $30.5 resistance and currently trades at $19.12. Today, the coin price is up 1.27% but backed by low volume activity, which suggests weakness in bulls’ commitment.
Therefore, if the selling pressure persists, the altcoin could plunge to $18.2 and attempt to break below it. Doing so will extend the ongoing downfall to June’s low support of $13.8.
On a contrary note, if the buyers defend the $18.2 support, the bullish pattern will remain intact, and the possibility of the Avalanche coin price will rise to the $30.5 neckline.
Technical Indicators
EMA’s: the downsloping crucial EMA’s (20, 50, 100, and 200) shows an overall downtrend. Moreover, the 50-day EMA slope is a dynamic resistance to coin price.
RSI indicator: the daily-RSI slope dived below the midline, indicating the market sentiment has turned negative.
- Resistance levels: $22.16 and $26.2
- Support levels: $20 and $16
Play 10,000+ Casino Games at BC Game with Ease
- Instant Deposits And Withdrawals
- Crypto Casino And Sports Betting
- Exclusive Bonuses And Rewards


Why Trust CoinGape
CoinGape has covered the cryptocurrency industry since 2017, aiming to provide informative insights Read more…to our readers. Our journal analysts bring years of experience in market analysis and blockchain technology to ensure factual accuracy and balanced reporting. By following our Editorial Policy, our writers verify every source, fact-check each story, rely on reputable sources, and attribute quotes and media correctly. We also follow a rigorous Review Methodology when evaluating exchanges and tools. From emerging blockchain projects and coin launches to industry events and technical developments, we cover all facets of the digital asset space with unwavering commitment to timely, relevant information.


- PM Modi Holds Emergency Meet as Iran Seeks India’s ‘Independent Role’ in Ending US-Iran War
- US-Iran Tensions Spike as Trump Sets 48-Hour Deadline on Strait of Hormuz Blockade
- Breaking: U.S. Prepares for Potential Peace Talks in Iran War as Trump Mulls ‘Winding Down’ Military Efforts
- Crypto Market Recovers as Expert Warns U.S. Easing of Iran Sanctions Won’t Stabilize Oil Prices
- CLARITY Act May Still Delay Despite Stablecoin Yield Deal, Galaxy’s Alex Thorn Warns
- XRP Price Prediction Ahead of March 27 SEC Spot ETF Decision
- Will Solana Price Recover This Week Amid New SEC/CFTC Crypto Rules?
- Ethereum, XRP, and Solana Price Prediction As CLARITY Act Advances After Senate–White House Deal
- Why is Pi Network Price Up Today (March 21) Despite Market Wide Correction?
- Bittensor (TAO) Price Surges 20% After Nvidia CEO Comments
- Dogecoin, Shiba Inu, and Pepe Coin Price Prediction If BTC Holds $70k Level


