 Claim Card
Avalanche Price Analysis: AVAX Bulls Aims $26.0 As Holds Bullish Trend line


Avalanche (AVAX) price analysis for today suggests a bullish bias. The coin moves with the bulls as the bears covered their short positions near the ascending trend line. The bullish slopping line from the lows of $16.36 acted as strong support for AVAX buyers. The price decline seems to have stabilized recently, at $22.20 support has held twice. This could be the beginning of the consolidation ranging from $22.0-$26.0.
As of publication time, AVAX/USD is reading at $23.80, up 3.14% for the day. The market cap is increasing and is currently at $17,020,333,263, while the 24-hour trading volume is holding at $486,655,219 with 4% of gains. The price opened lower but recovered sharply to test the intraday high with rising volume. This is a bullish sign.
- AVAX price bucks the prevailing downtrend and sustains gains on Wednesday.
- As the bulls hold the ascending trend line firmly, a next leg-up toward $26.0 and beyond is expected.
- However, a daily candlestick below $22.20 would invalidate the bullish outlook.
AVAX price look for an upside reversal
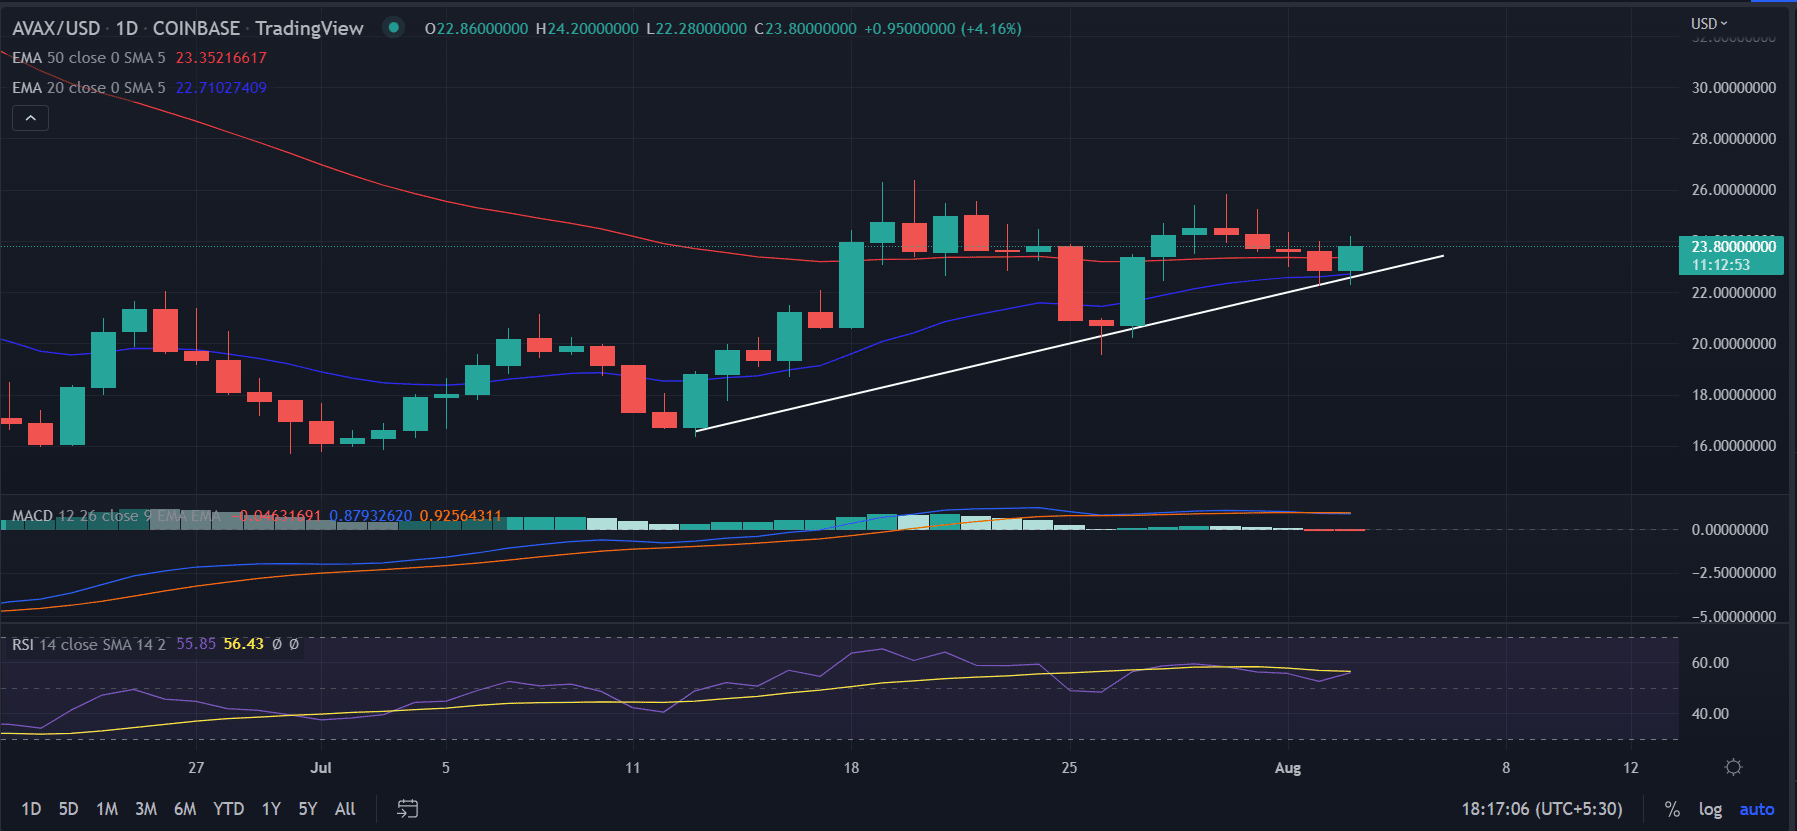
On the daily time frame, the Avalanche (AVAX) price analysis shows that the price is moving near the bullish trend line. Currently, the price managed to hold the gains on Wednesday following four consecutive sessions of fall from the swing highs of $25.81 made on July 29.
In the past as well, whenever the price tested the trend line, it experienced a bounce back from the lower levels as can be seen on the chart. Hence, we expect an appreciation of 30% from the current levels. A renewed buying pressure would push the price toward the swing highs of $25.81 followed by the $28.0 horizontal resistance level.
To further confirm the analysis, let’s understand what technical indicators are telling
Moving Average Crossover: The price is taking support near the crucial 20-day and 50-day EMA crossover, indicating a probable bounce back from the current levels
RSI: The RSI (14) attempts to breach the average line that would further strengthen the bullish outlook. Currently, it reads at 55.
MACD: The AMCD holds above the midline with a receding bullish momentum.
On the flip side, a change in the bullish sentiment could result in the continuation of the prevailing downside momentum. A break below the session’s low could ignite a fresh round of selling the coin. In that case, the first downside target could be found at the low of July 18 at $20.57.
Next, the market participant would exploit the $19.50 level, as this also coincides with the break of the 20-day EMA.

Why Trust CoinGape
CoinGape has covered the cryptocurrency industry since 2017, aiming to provide informative insights Read more…to our readers. Our journal analysts bring years of experience in market analysis and blockchain technology to ensure factual accuracy and balanced reporting. By following our Editorial Policy, our writers verify every source, fact-check each story, rely on reputable sources, and attribute quotes and media correctly. We also follow a rigorous Review Methodology when evaluating exchanges and tools. From emerging blockchain projects and coin launches to industry events and technical developments, we cover all facets of the digital asset space with unwavering commitment to timely, relevant information.

Related Articles


- US Senator Launches Probe Into Binance After Fortune Report on Sanctions Violations
- CLARITY Act Odds, Bitcoin Drop as Trump Skips Crypto in State of the Union Speech
- Tokenized Stock Market Gains Boost as Kraken and Binance Launches New Products
- Peter Schiff Casts Doubt on Bitcoin Rally Ahead of Trump’s SOTU Speech
- Putin Signs Law to Confiscate Bitcoin Amid Russia’s Crypto Crackdown, Pavel Durov Probe
- Cardano Price Signals Rebound as Whales Accumulate 819M ADA
- Sui Price Eyes Recovery as Third Spot SUI ETF Debuts on Nasdaq
- Pi Network Price Eyes a 30% Jump as Migrations Jumps to 16M
- Will Ethereum Price Dip to $1,500 as Vitalik Buterin Continues Selling ETH?
- XRP Price Outlook as Clarity Act Passage Odds Plunge to 53%
- COIN Stock Risks Crashing to $100 as Odds of US Striking Iran Jump


