 Buy Presale
Bearish Pattern In Play Puts SHIB Price at a Risk of 10% Drop


Amidst the current bearish wave in the crypto space, the Shiba Inu coin price saw a 3% decline earlier today. This slump precipitated a breakdown from an inverted pennant pattern. However, a subsequent influx of buyers around the $0.000007 mark led to an upward thrust, culminating in a long-tail rejection candlestick. While this sudden demand surge suggests a potential short-term upswing, is it robust enough to fuel a more pronounced recovery?
Also Read: Shiba Inu Admin Profile Hack, All You Should Know
Demand Pressure at Key Support
- The triangle formation may prolong the sideways trend in the SHIB price
- A breakdown below the lower trendline will intensify the supply pressure
- The intraday trading volume of the Shiba Inu coin is $88 Million, showing a 2.4% loss.
 Source- Tradingview
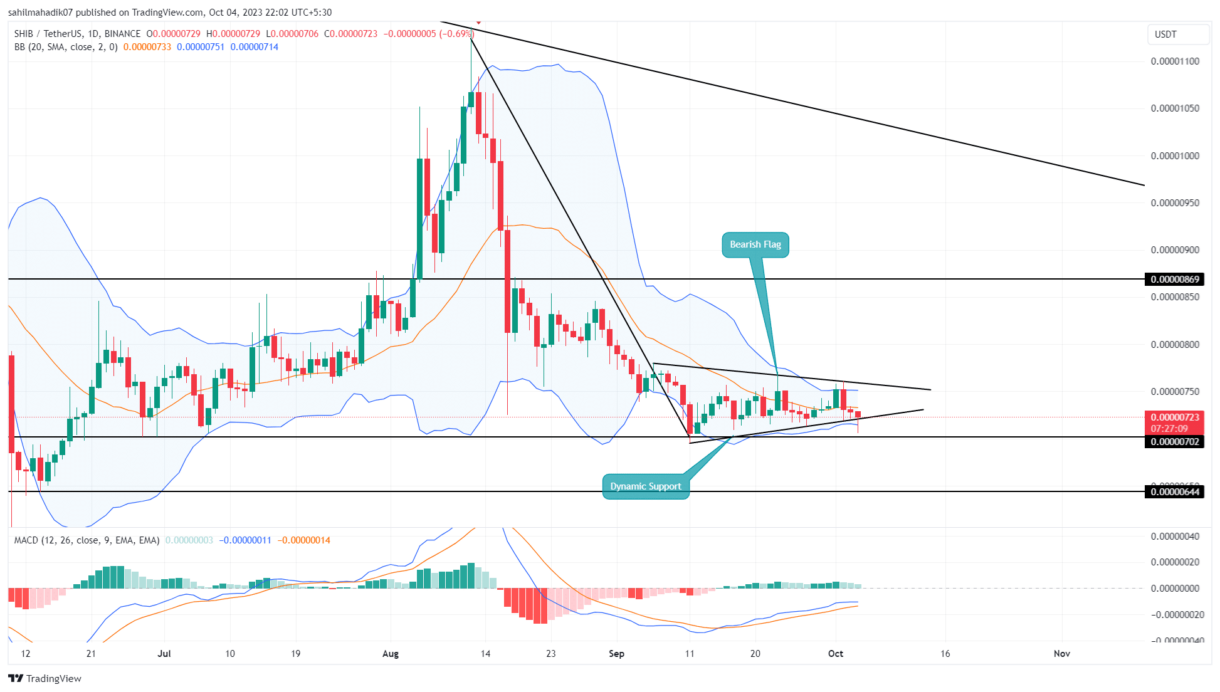
Over the past month, the Shiba Inu price has oscillated within a defined range, confined by two converging trendlines. These trendlines, which act as dynamic resistance and support, delineate a triangular structure—often referred to as an inverted pennant, a bearish continuation pattern.
Today’s candlestick, with its pronounced tail, marks a conflict between selling pressure and this lower trendline, hinting at a potential bullish reversal. If this plays out, we could see the SHIB price ascend by approximately 4.5%, aiming for the upper trendline where it may encounter another round of resistance.
Based on this pattern, it’s likely that the Shiba Inu coin will remain under the bearish influence in the upcoming trading sessions. Given that pennants typically indicate trend continuation, there’s a possibility that the sellers will breach the support trendline.
If this transpires with a confirmed daily candle close below the trendline, the selling pressure could intensify, potentially dragging the coin down by 10% toward the $0.00000664 support level.
SHIB vs DOGE Performance
 Source: Coingape| Dogecoin Vs Shiba Inu Price
A retrospective glance at the Shiba Inu price movement over the past three months reveals a pronounced correction since mid-August. While the SHIB price has charted a clear bearish path characterized by successive lower lows and lower highs, its counterpart, Dogecoin, has displayed a relatively sideways trend. In the face of the recent crypto market pullback, Shiba Inu bore a more significant brunt compared to the Dogecoin price, which only experienced a minor dip.
- Bollinger Band: The range of Bollinger band shrinks narrow, reflecting increasing volatility.
- Moving Average Convergence Divergence: A bullish alignment between the MACD(blue) and signal(orange) accentuates the buyer’s attempt to prolong a relief rally.
Play 10,000+ Casino Games at BC Game with Ease
- Instant Deposits And Withdrawals
- Crypto Casino And Sports Betting
- Exclusive Bonuses And Rewards


Why Trust CoinGape
CoinGape has covered the cryptocurrency industry since 2017, aiming to provide informative insights Read more…to our readers. Our journal analysts bring years of experience in market analysis and blockchain technology to ensure factual accuracy and balanced reporting. By following our Editorial Policy, our writers verify every source, fact-check each story, rely on reputable sources, and attribute quotes and media correctly. We also follow a rigorous Review Methodology when evaluating exchanges and tools. From emerging blockchain projects and coin launches to industry events and technical developments, we cover all facets of the digital asset space with unwavering commitment to timely, relevant information.
24 Hours volume
$99.76M
Market Cap
$3.79B
Max Supply
1000T

Related Articles


- CLARITY Act: Banks, Crypto Yet To Agree On New Crypto Bill Draft As March 1 Deadline Looms
- Michael Saylor Predicts $50T From Bonds Could Flow Into Bitcoin Ecosystem as Digital Credit Evolves
- Bitcoin Treasury Firm GD Culture Authorizes Sale of 7,500 BTC as Expert Warns Of More ‘Pain’
- USDT And USAT Get Adoption Boost as Tether Invests in Whop for Faster Settlements
- BTC Price Rises as U.S. Plans to Hold Trump Tariffs on China Steady
- XRP Price Eye $2 Rebound as On-Chain Data Signals Massive Whale Accumulation
- Ethereum Price Reclaims $2K- New Rally Ahead or a Temporary Bounce?
- COIN Stock Price Prediction as Wall Street Pros Forecast a 62% Surge
- Cardano Price Signals Rebound as Whales Accumulate 819M ADA
- Sui Price Eyes Recovery as Third Spot SUI ETF Debuts on Nasdaq
- Pi Network Price Eyes a 30% Jump as Migrations Jumps to 16M


