 Buy $GGs
Bearish Pennant Pattern Puts SHIB Price at Risk of 12% Downfall


Recently, the crypto market witnessed significant outflow leading to a downward projection in the majority of major digital coins. As a result, the popular memecoin Shiba Inu has been falling for three consecutive days, recording a 6.2% loss. Amid this downfall, the sellers breached the lower support trendline of a bearish pennant pattern, indicating the coin price is likely to witness a further fall.
Also Read: Major Japanese Exchange to Support Shiba Inu on Polygon
Bearish Pennant Trigger Longer Correction Trend For SHIB Price
- Bearish pennant breakdown accelerates the selling momentum in Shib
- Crypto buyers may face strong demand pressure at $0.000007
- The intraday trading volume of the Shiba Inu coin is $110.2 Million, showing a 7.2% gain.
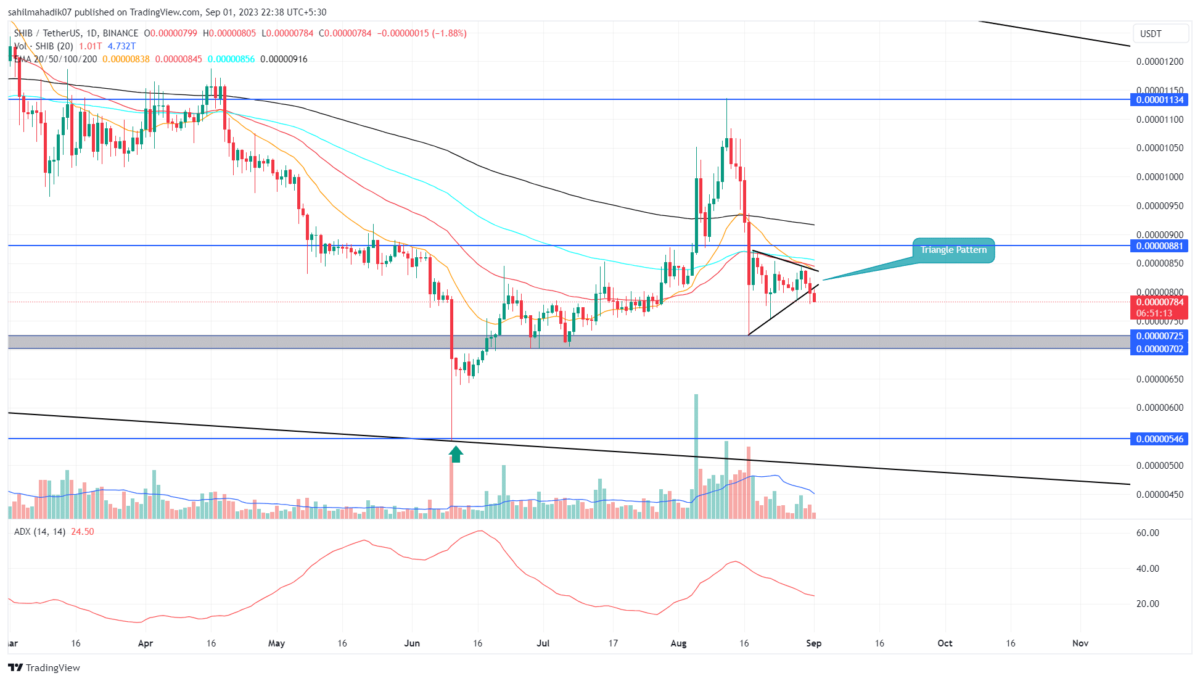
 Source- Tradingview
Amid the last two weeks of consolidation, the Shiba Inu price resonated between two converging trendlines which acted as dynamic resistance and support. This triangular shape after a sharp fall revealed the formation of a downtrend continuation pattern called inverted pennant.
This chart setup is used to provide sellers with a short break to re-energize bearish momentum. On August 31st, the coin price gave a breakdown from the pattern’s lower trendline as a signal of resumption of downward momentum.
Currently, the SHIB price is down 0.63% offering a suitable follow-up for sellers. With sustained selling, this memecoin should be 12% down to challenge $0.000007 psychological support, followed by $0.00000545.
Will SHIB Price Fall Below $0.000007?
While the potential bearish momentum in SHIB price seems valid and sufficient to hit $0.000007 support, the daily price reflects signs of demand pressure that may limit this downfall. Amid the last few week’s sideways lactations, the coin price shows a long-lower price rejection candle, indicating the buyers becoming aggressive at lower levels.
Thus, the ongoing correction may hold at $0.000007 to rebuild the bullish momentum.
- Exponential Moving Average: The overhead EMAs(20, 50, and 100) show multiple resistance to pressurize the coin buyers
- Average Directional Index: Despite a significant breakdown, the ADX slope shows no uptick reflecting some weakness in selling momentum.
Play 10,000+ Casino Games at BC Game with Ease
- Instant Deposits And Withdrawals
- Crypto Casino And Sports Betting
- Exclusive Bonuses And Rewards


Why Trust CoinGape
CoinGape has covered the cryptocurrency industry since 2017, aiming to provide informative insights Read more…to our readers. Our journal analysts bring years of experience in market analysis and blockchain technology to ensure factual accuracy and balanced reporting. By following our Editorial Policy, our writers verify every source, fact-check each story, rely on reputable sources, and attribute quotes and media correctly. We also follow a rigorous Review Methodology when evaluating exchanges and tools. From emerging blockchain projects and coin launches to industry events and technical developments, we cover all facets of the digital asset space with unwavering commitment to timely, relevant information.

Related Articles


- Peter Brandt Flips Bullish, Predicts Bitcoin Rally As Price Holds Above $70k
- XRP News: Institutional Use Case Expands as Doppler Finance Integrates WXRP for Multi-Chain Access
- Trump Tariffs: Bitcoin Faces Fresh Headwinds as 15% Global Tariffs Begin This Week Amid Iran War
- Bitget Unveils ‘Crypto Anti-Bias Pledge’ To Support Women’s Inclusion In Crypto
- U.S.-Iran War: Crypto Market Rebounds as Iran Reportedly Reaches Out To U.S. To End Conflict
- Dogecoin Price Outlook as BTC Recovers Above $73,000
- XRP Price Prediction as Iran-U.S. Peace Talks Trigger a Crypto Rally
- COIN Stock Analysis as Bitcoin Retests $72k Ahead of February NFP Data
- Robinhood Stock Price Prediction As Cathie Wood Buys $12M Dip in Bold ARK Move
- Bitcoin Price At Risk? Professor Who Predicted US-Iran War Says America Could Lose
- Gold Price Prediction March 2026: Rally, Crash, or Record Highs?


