 Claim Card
Binance Coin (BNB) Price Eyes 10% Jump Amid Bullish Pattern Formation


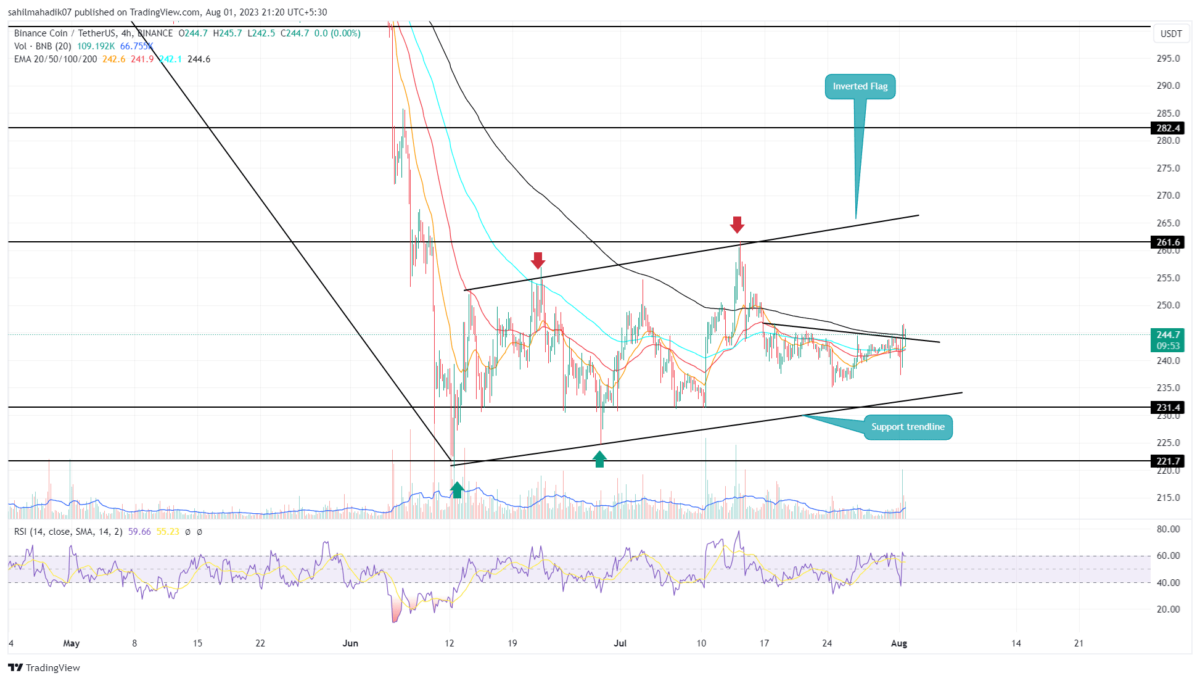
The Binance coin price in four-time frame charts shows a bullish upswing under the influence of a rising channel pattern. For nearly two months, the coin price has been wobbling between the two parallel walking trendlines acting as dynamic resistance and support. The BNB price close to the bottom trendline shows a sign of a bullish reversal and potential for a sharp rally.
Also Read: BNB Price Trade Idea As Binance Bags Dubai’s Major Exchange License
Binance Price Daily Chart
- A bullish crossover between the 20 and 100 EMA should lure more buyers into the market.
- A bullish pattern sets the BNB price for a 10% upswing
- The intraday trading volume in the BNB coin is $596.5 Million, indicating a 17.5% loss
 Source- Tradingview
Amid the recent uncertainty in the crypto market, the BNB price showed a sideways action limited between the range of $245 to $234. This two weeks consolidation showed the formation of a bullish reversal pattern called inverted head and shoulder. With an intraday game of 1.62%, the altcoin price gave a bullish breakout from the pattern’s neckline resistance.
By the press time, the Binance coin trades at $244 and tries to sustain above the breached trendline. If the buyers manage to hold this flipped support, the altcoin could prolong the recovery by 10% and reach the overhead trendline of the channel pattern.
Until the two trendlines remain intact, the Binance coin may linger in a sideways or slightly ascending trend.
[converter id=”bnb-binance-coin” url=”https://coingape.com/price/converter/bnb-to-usd/?amount=1″]
Is BNB Price Still Under Correction Threat?
A look at the daily time frame chart shows the channel pattern is part of an inverted flag. This chart pattern is known to extend the downward trend upon the breakdown of its supported line. This crackdown will intensify the selling momentum and may plunge Binance coin to $220, followed by $200.
Play 10,000+ Casino Games at BC Game with Ease
- Instant Deposits And Withdrawals
- Crypto Casino And Sports Betting
- Exclusive Bonuses And Rewards


Why Trust CoinGape
CoinGape has covered the cryptocurrency industry since 2017, aiming to provide informative insights Read more…to our readers. Our journal analysts bring years of experience in market analysis and blockchain technology to ensure factual accuracy and balanced reporting. By following our Editorial Policy, our writers verify every source, fact-check each story, rely on reputable sources, and attribute quotes and media correctly. We also follow a rigorous Review Methodology when evaluating exchanges and tools. From emerging blockchain projects and coin launches to industry events and technical developments, we cover all facets of the digital asset space with unwavering commitment to timely, relevant information.

Related Articles


- Crypto Market Soars on Rumors of Trump’s 0% Tax Policy for Digital Assets
- Hong Kong Set to Launch Tokenized Bond Platform and Issue First Stablecoin Licenses
- US Senator Launches Probe Into Binance After Fortune Report on Sanctions Violations
- CLARITY Act Odds, Bitcoin Drop as Trump Skips Crypto in State of the Union Speech
- Tokenized Stock Market Gains Boost as Kraken and Binance Launches New Products
- Cardano Price Signals Rebound as Whales Accumulate 819M ADA
- Sui Price Eyes Recovery as Third Spot SUI ETF Debuts on Nasdaq
- Pi Network Price Eyes a 30% Jump as Migrations Jumps to 16M
- Will Ethereum Price Dip to $1,500 as Vitalik Buterin Continues Selling ETH?
- XRP Price Outlook as Clarity Act Passage Odds Plunge to 53%
- COIN Stock Risks Crashing to $100 as Odds of US Striking Iran Jump


