 Claim Card
Binance Coin Price Analysis: Falling $BNB Price Revisit Multi-Month Support; Best Dip Opportunity?


Binance Coin Price Analysis: Binance the world’s largest crypto exchange facing legal action against the U.S. The Securities and Exchange Commission (SEC) has put its native token BNB under intense selling pressure. Within the week, the altcoin’s market value dropped 17.5% and plunged to a low of $253.3. However, the aforementioned support aligned with the long-coming support trendline of the triangle pattern indicates the BNB price stands at a high accumulation zone.
Also Read: Binance US To Remove Hundreds Of Trading Pairs; Halts OTC Trading
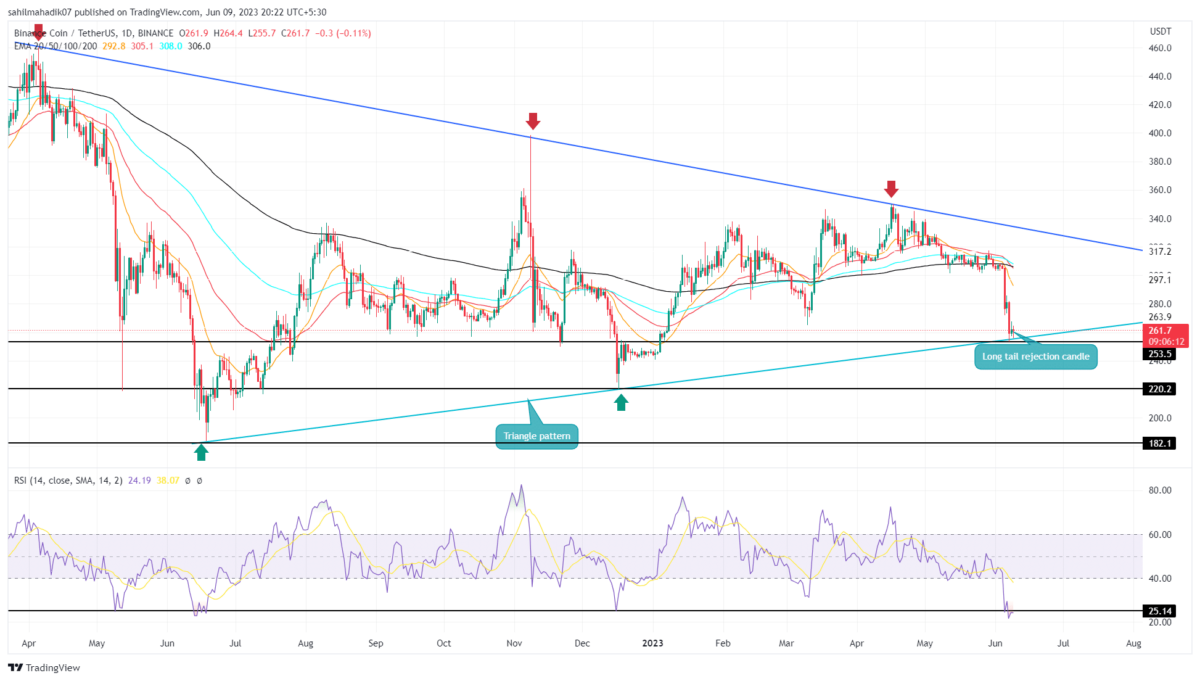
Binance Coin Price Daily Chart
- A bullish reversal from the triangle pattern’s support trendline offers a bullish swing opportunity to traders.
- A daily RSI slope plunge to the Dec 2022 low after which the BNB price witnessed a massive rally of nearly a year
- The intraday trading volume in the BNB coin is $389.5 Million, indicating an 11.2% loss
 Source- Tradingview
The Binance coin price shows the formation of a symmetrical triangle pattern in the daily time frame chart. This pattern consists of two converging trendlines that create a shrinking range and eventually lead to massive upon on the breakout side.
By press time, the BNB price traded at the $262.6 mark and continued to hover above the long-coming support trendline. With an intraday gain of 0.3%, the daily chart shows a long-tail rejection at this multiple-month support indicating the buyers are accumulating at this support.
The rise in bullish momentum could lead to a bullish reversal and surge the coin price back to a higher level. The potential rally could push the prices back to the overhead trendline near the $315 mark, registering a 20% growth potential.
A breakdown below the mentioned trendline will invalidate the bullish thesis.
Will the BNB price go back to $300?
In theory, a bullish reversal from the triangle pattern’s support trendline triggers a new bull cycle. This reversal could offer a short-term trade opportunity and lead the price back to $300 to meet the above trendline. Anyhow, the traders can expect a sustained recovery rally only if the price breach the overhead trendline
- Relative Strength Index: The daily RSI slope dives to the oversold region indicate the seller activity went overboard and more buyers could take advantage of a discounted price
- Exponential Moving Average: A bearish crossover between the 50-and-200-day EMA may increase the selling pressure in the market, and could trigger a minor consolidation above the trendline

Why Trust CoinGape
CoinGape has covered the cryptocurrency industry since 2017, aiming to provide informative insights Read more…to our readers. Our journal analysts bring years of experience in market analysis and blockchain technology to ensure factual accuracy and balanced reporting. By following our Editorial Policy, our writers verify every source, fact-check each story, rely on reputable sources, and attribute quotes and media correctly. We also follow a rigorous Review Methodology when evaluating exchanges and tools. From emerging blockchain projects and coin launches to industry events and technical developments, we cover all facets of the digital asset space with unwavering commitment to timely, relevant information.

Related Articles


- Expert Predicts Deeper Bitcoin Decline as JPMorgan CEO Warns of Similarities to the 2008 Financial Crisis
- Trump Won’t Pardon FTX’s Sam Bankman-Fried (SBF), White House Says
- Third Spot SUI ETF Goes Live as 21Shares Fund Launches on Nasdaq
- Mark Zuckerberg’s Meta Reportedly Eyes Stablecoin Integration This Year Amid Regulatory Clarity
- Coinbase Rivals Robinhood As It Rolls Out Stocks, ETFs Trading In ‘Everything Exchange’ Push
- Cardano Price Signals Rebound as Whales Accumulate 819M ADA
- Sui Price Eyes Recovery as Third Spot SUI ETF Debuts on Nasdaq
- Pi Network Price Eyes a 30% Jump as Migrations Jumps to 16M
- Will Ethereum Price Dip to $1,500 as Vitalik Buterin Continues Selling ETH?
- XRP Price Outlook as Clarity Act Passage Odds Plunge to 53%
- COIN Stock Risks Crashing to $100 as Odds of US Striking Iran Jump


