 Buy $GGs
Binance Coin Price Analysis: Will $BNB Price Lose $200 Mark in June?


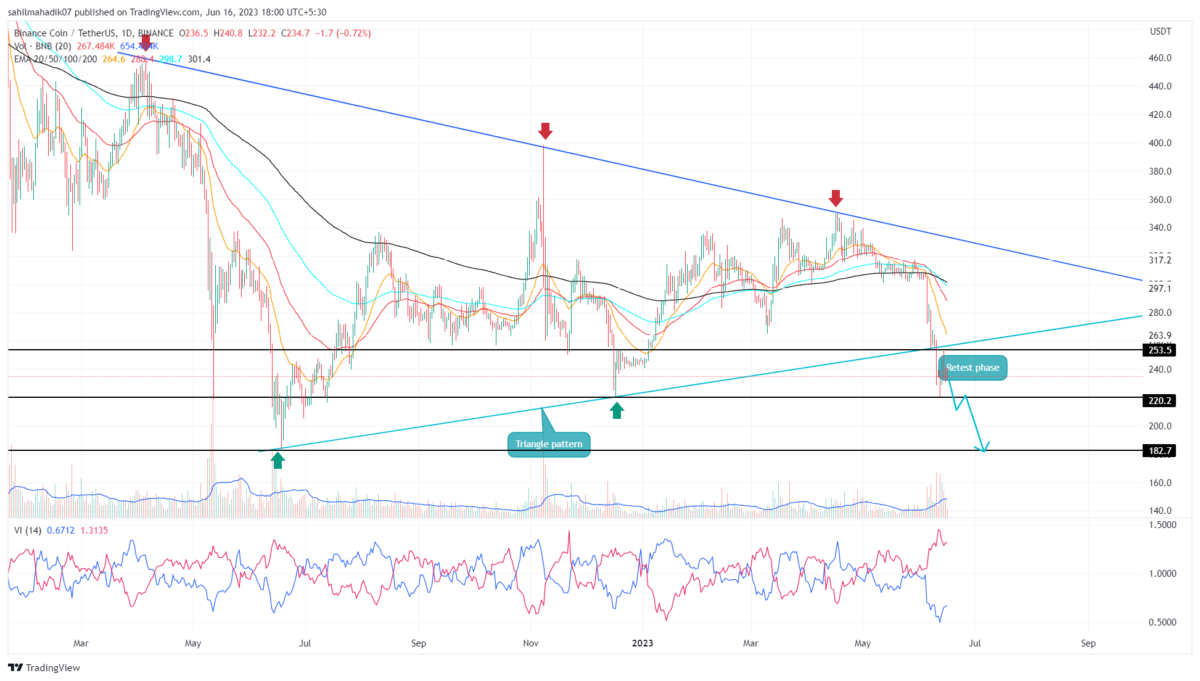
Binance Coin Price Analysis: On June 10th, the Binance coin price gave a decisive breakout from the support trendline of a triangle pattern that carried a sideways trend for nearly a year. This breakdown must have released the trapped bearish momentum and set the BNB price for a prolonged downfall. In theory, each swing low formed during the triangle formation can act as a significant target for traders.
Also Read: Binance’s BNB Chain To Announce Layer 2 Blockchain Solution
Binance Price Daily Chart:
- $200 stands as a high-demand zone for BNB buyers
- A bearish crossover between the 100-and-200-day EMA could attack more sell orders in the market.
- The intraday trading volume in the BNB coin is $470.5 million, indicating an 24.6% loss.
 (Source: Tradingview)
Earlier this week, the BNB price witnessed a minor pullback in its ongoing downtrend and retested the breached trendline for potential resistance. A long-wick rejection candle formed at the flipped resistance indicates a shift in market sentiment toward continuing the downward trend.
From the retest point of $253.5, the coin price plunged by 7.85% to reach the current price of $234 mark. With strong selling momentum, the sellers are likely to push the price another 6% to revisit the $220 mark
The $220 level is multi-month support and that could delay the potential fall and turn the BNB price sideways for a brief period. Consider a pessimistic scenario, a breakdown below $220 is more likely to plunge the price back to $200 psychological support.
Will the Binance Coin Price Plunge to $200?
The symmetrical triangle pattern’s completion on a bearish note suggests a significant downfall for BNB’s price. The reject retest phase confirms the presence of supply pressure from selling, suggesting the price could plunge to $220, followed by $200. However, to maintain stability in this altcoin any further downfall from the aforementioned level is less likely to June
- Vortex Indicator: A wide gap between the VI+ and VI- slope in a bearish alignment(VI->VI+) reflects the overall market trend is bearish
- Exponential Moving Average: Under aggressive bearish momentum, the 20-day EMA can act as dynamic resistance to prolong the downward trend.
Play 10,000+ Casino Games at BC Game with Ease
- Instant Deposits And Withdrawals
- Crypto Casino And Sports Betting
- Exclusive Bonuses And Rewards


Why Trust CoinGape
CoinGape has covered the cryptocurrency industry since 2017, aiming to provide informative insights Read more…to our readers. Our journal analysts bring years of experience in market analysis and blockchain technology to ensure factual accuracy and balanced reporting. By following our Editorial Policy, our writers verify every source, fact-check each story, rely on reputable sources, and attribute quotes and media correctly. We also follow a rigorous Review Methodology when evaluating exchanges and tools. From emerging blockchain projects and coin launches to industry events and technical developments, we cover all facets of the digital asset space with unwavering commitment to timely, relevant information.

Related Articles


- U.S.-Iran War: U.S. Oil Prices Spike To One-Year High, Bitcoin and Gold Dip
- Crypto Traders Bet Against U.S.-Iran Ceasefire This Month as Iran Denies Peace Talks
- Ripple Prime Adds Support For Bitcoin, Ethereum, XRP, Solana Derivatives on Coinbase
- Bitcoin Price Still Risks Decline If Iran War Mirrors Ukraine War Market Reaction, JPMorgan Warns
- Bitget Unveils Upgrade For Stock, Gold Trading Alongside Crypto As Part Of Universal Exchange Push
- HOOD Stock Targets $100 as Robinhood Unveils Platinum Card and Advance Dividend Feature
- Bitcoin Price Prediction if Donald Trump Signs the CLARITY Act on April 3, 2026
- Pi Network Price As BTC Rallies Above $74K: Can PI Coin Extend Gains to $0.30?
- XRP Price As Bitcoin Reclaims $74K- Is $5 Next?
- Dogecoin Price Outlook as BTC Recovers Above $73,000
- XRP Price Prediction as Iran-U.S. Peace Talks Trigger a Crypto Rally


