Binance Coin Price Risks Crash to $700 as Key BSC Metric Plunges 80%


Highlights
- Binance Coin price has formed a bearish pennant chart pattern on the daily timeframe chart.
- The token also remains below the Supertrend indicator, a sign that the bearish outlook continues.
- The number of transactions in the BSC network has plunged by 80% in the last 30 days.
Binance Coin price dropped by over 1% today, Dec. 29, as the crypto market remained under pressure. The BNB token was trading at $850, down sharply from the year-to-date high of $1,375. It is at risk of a deeper dive, potentially to the key support level at $700 as a risky pattern forms and key metrics, including transactions and futures open interest plunge.
Binance Coin Price Technical Analysis Points to a Crash to $700
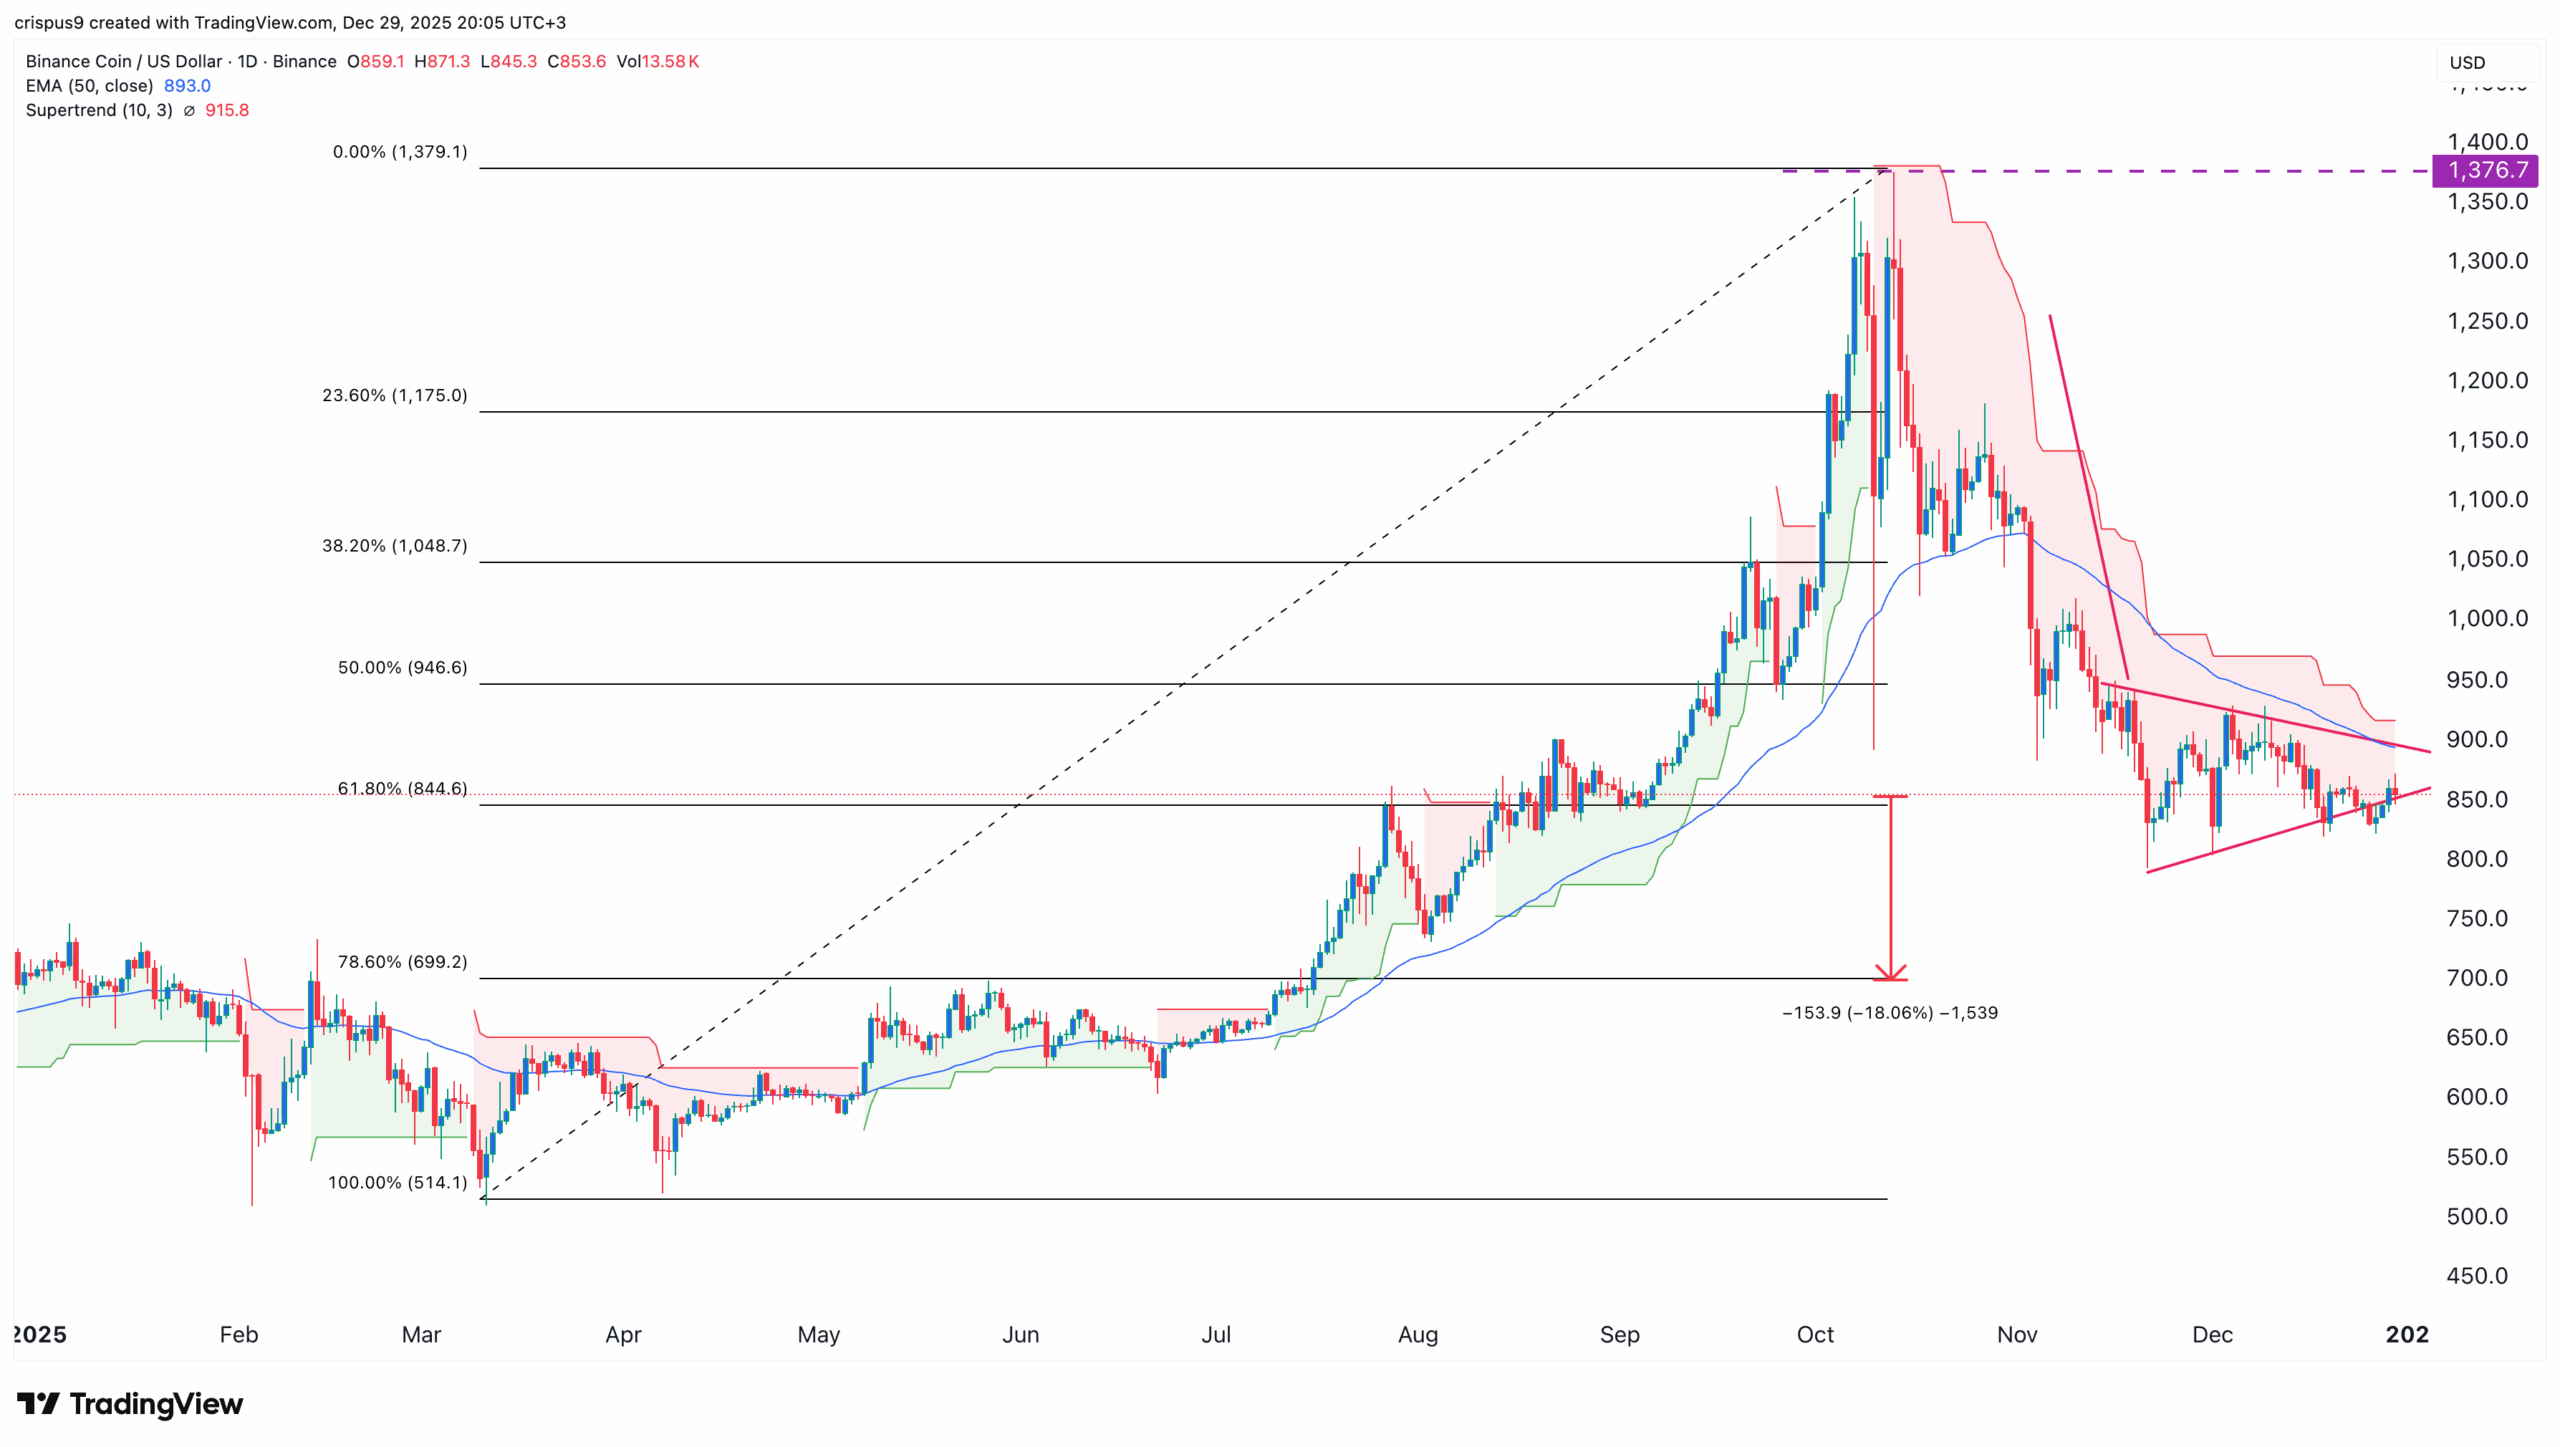
The daily timeframe chart shows that the BNB price has sold off in the past few months, erasing some of the gains made earlier this year when it jumped to a record high of $1,376.
This chart points to more downside in the coming weeks as it has formed the risky bearish pennant pattern. It has already formed the vertical or the flagpole section, and is now in the pennant section. The two lines of this pennant are about to converge, which will likely lead to more downside.
The token is oscillating at the 61.8% Fibonacci Retracement level, where most rebounds normally happen. Also, Binance Coin has remained below the Supertrend indicator and the 50-day Exponential Moving Average (EMA).
Therefore, the most likely BNB price prediction is bearish, with the next important target to watch being at $700, the 78.6% Fibonacci Retracement level, which is nearing 20% below the current level.
On the flip side, a jump above the 50% Fibonacci Retracement level at $945 will invalidate the bearish outlook.
Key BNB Smart Chain Metrics are Plunging
The Binance Coin price is facing substantial fundamental challenges as the crypto market crash continues.
One of these fundamentals is that demand for the coin has crashed in the past few months, a sign of weak demand among investors. Data compiled by CoinGlass shows that the daily volume plunged to $1 billion on Monday, down sharply from the year-to-date high of over $15 billion.
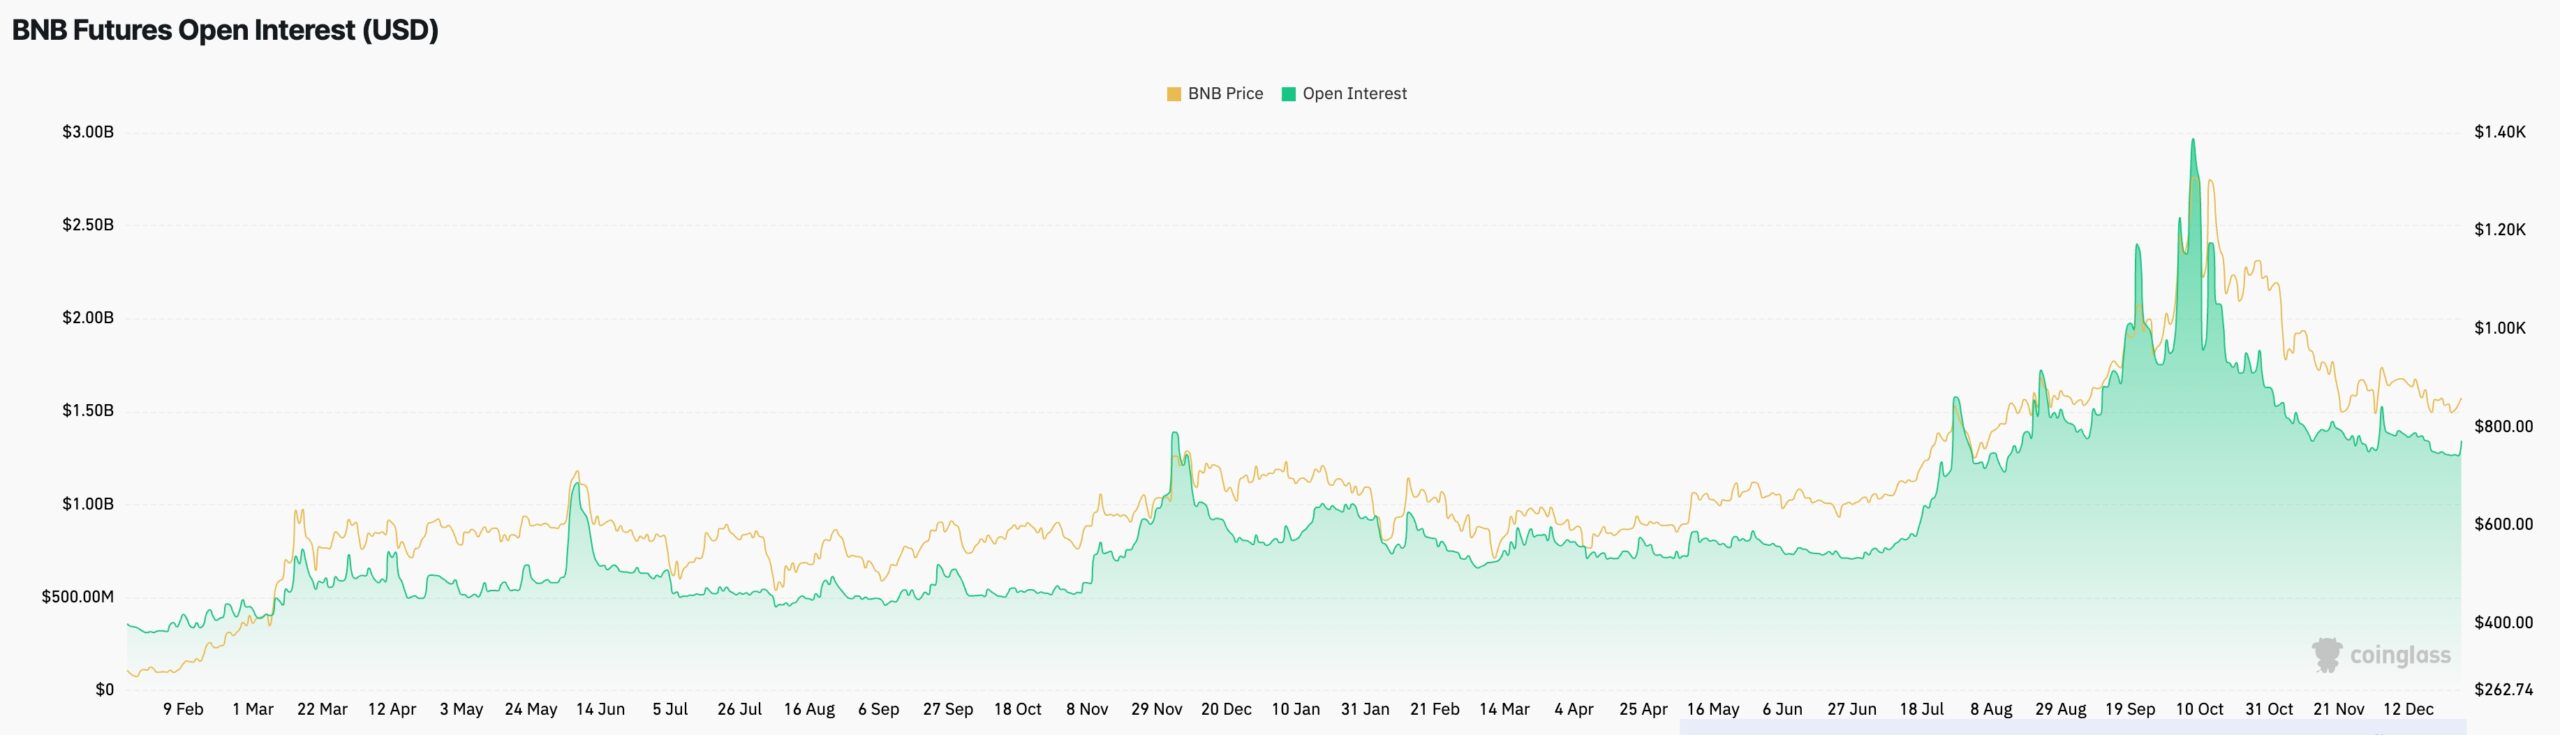
The same trend is happening in the futures market, where the open interest has dropped from the year-to-date high of $2.7 billion in October to the current $1.26 billion. This figure has dropped sharply since the huge liquidation event that happened on October 10.
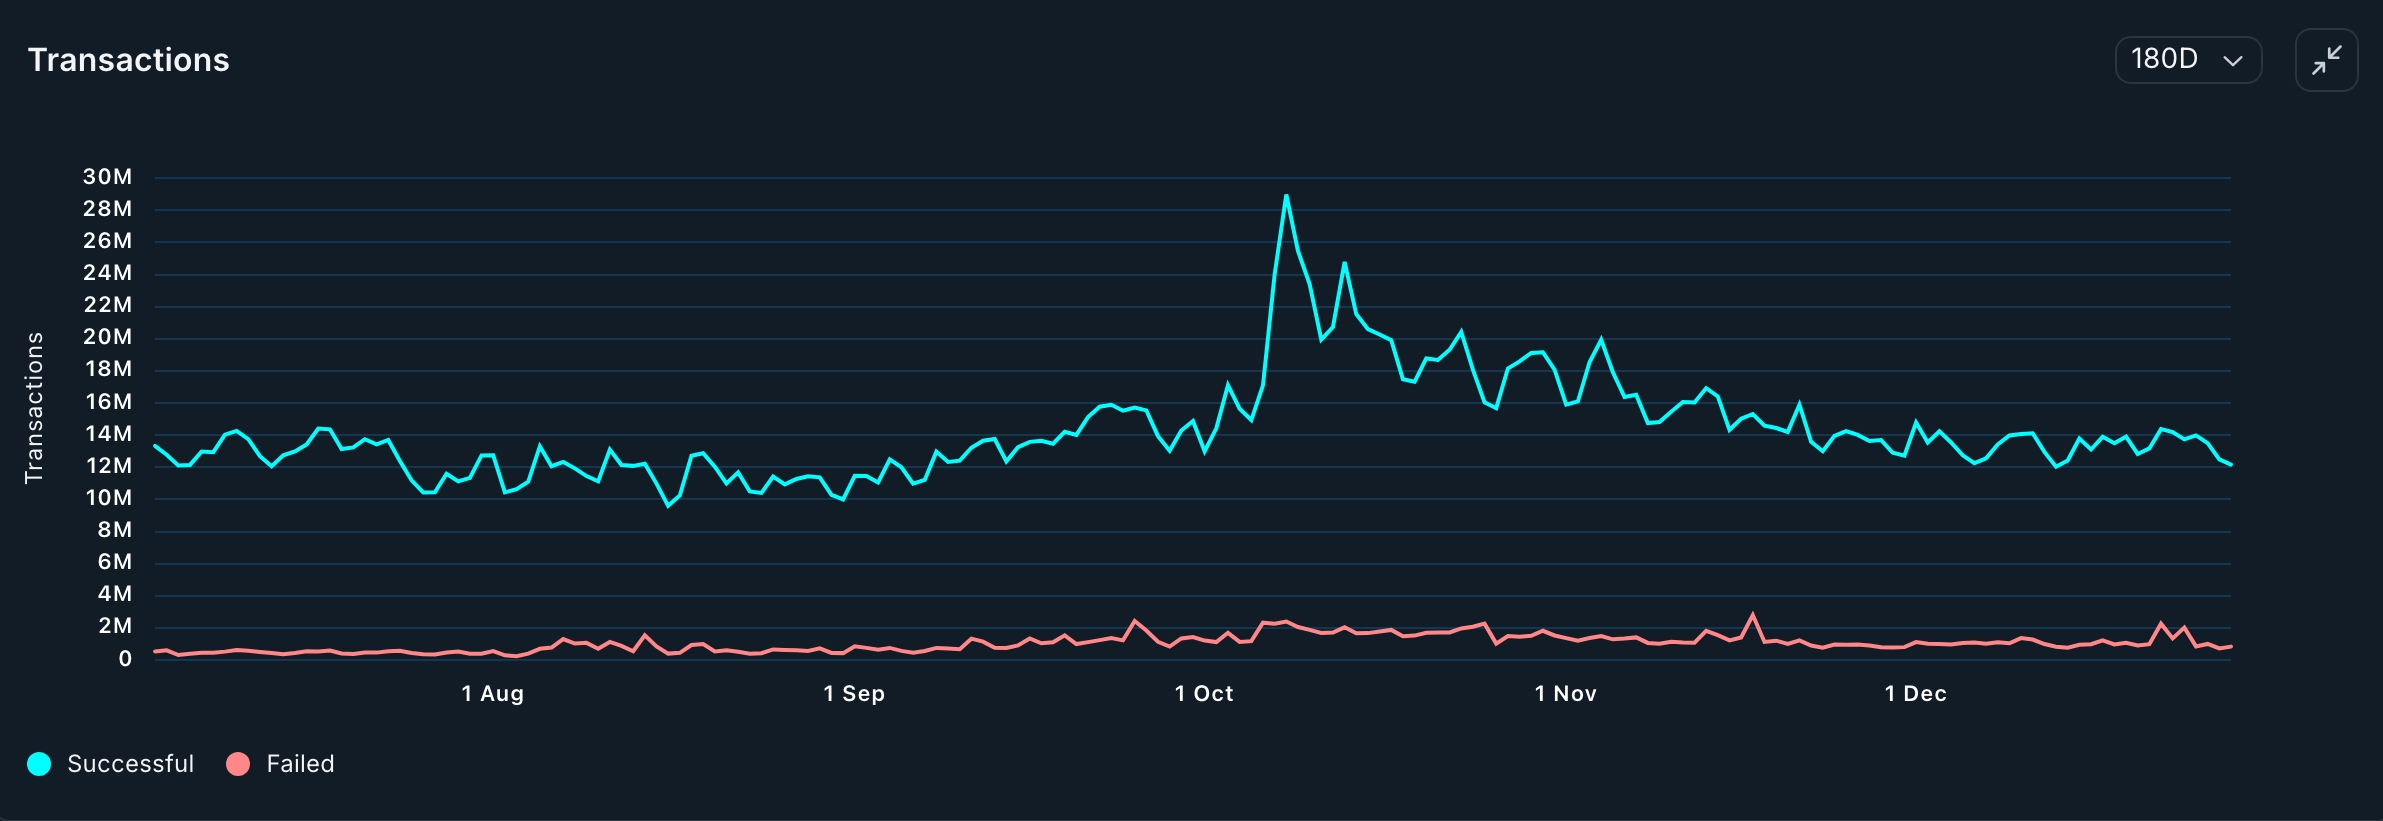
Meanwhile, the number of transactions in the network has continued falling in the past few weeks. Data compiled by Nansen shows that the number of transactions in the network has plunged by 80% in the last 30 days to 400 million.
The falling network transaction and activity in its decentralized finance (DeFi) has also led to a significant decline in its fees in the past few weeks. Total fees fell by 14% in this period to $14 million, meaning that fewer BNB tokens will be burned.
Frequently Asked Questions (FAQs)
1. What is the most likely Binance Coin price prediction?
2. How low can the BNB price get?
3. Is the Binance Coin a good crypto to buy?
Why Trust CoinGape
CoinGape has covered the cryptocurrency industry since 2017, aiming to provide informative insights Read more…to our readers. Our journal analysts bring years of experience in market analysis and blockchain technology to ensure factual accuracy and balanced reporting. By following our Editorial Policy, our writers verify every source, fact-check each story, rely on reputable sources, and attribute quotes and media correctly. We also follow a rigorous Review Methodology when evaluating exchanges and tools. From emerging blockchain projects and coin launches to industry events and technical developments, we cover all facets of the digital asset space with unwavering commitment to timely, relevant information.
24 Hours volume
$505.47M
Market Cap
$76.73B
Max Supply
200M


Will Bitcoin reach $250,000 by December 31, 2026?