 Buy $GGs
Bitcoin Price Prediction: BTC Prepares For A 26% Upside If Daily Price Closes Above This Level


Bitcoin (BTC) price trades with mild losses on Saturday. The price opened lower but quickly reverses the action and touched the day’s high at $40,300 after six days. However, the rally fizzled out quickly as BTC retraced back to $39,000. Thus the price is moving sideways with no meaningful price action.
- Bitcoin (BTC) price tracks lower on Saturday.
- Expect an upside of 26% if the price closes above $40k.
- Momentum oscillators warn of any aggressive bids.
In the recent development of the Russia-Ukrain war, Russian President Vladimir Putin has been reported to offer a high-level negotiation talk with Ukraine as he told to his Chinese counterpart Xi Jinping. On Friday, Nasdaq rose 1.64%, Dow Jones ended higher with 2.51%, and S&P 500 gained 2.24%.
As of press time, BTC/USD is trading at $39,024.07, down 0.58% for the day. The world’s largest and most famous currency held the 24-hour trading volume at $25,591,014,322.26 with a loss of 30%.
BTC price looks for bullish reversal
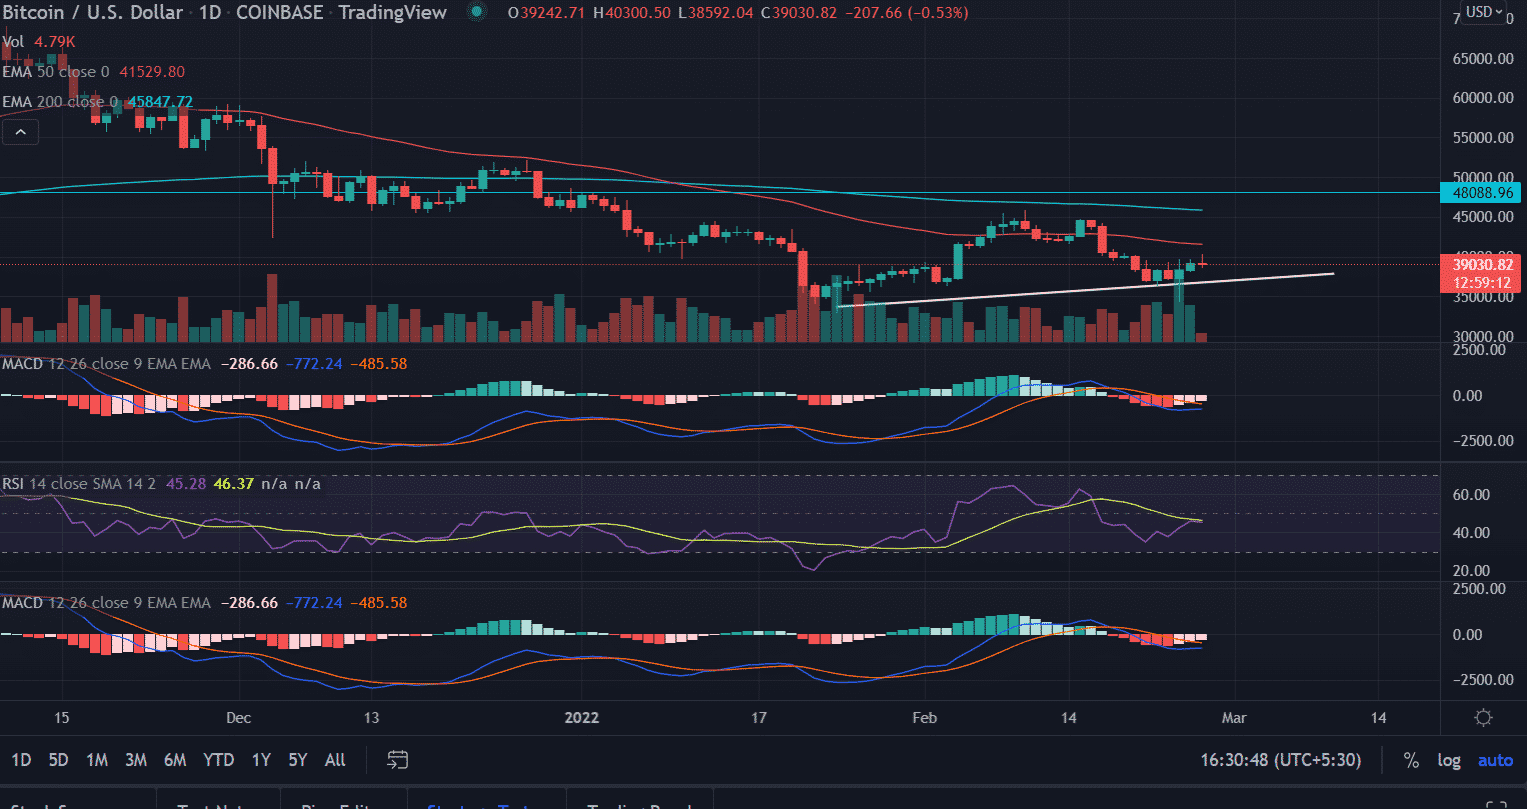
On the daily chart, Bitcoin (BTC) price after losing nearly 65% from the record highs made in November at $69,000, the price is looking to form a base in pursuit of another 26% upside from the current levels.
The ascending trend line from the lows of $32,933.33 acts as reliable support for BTC bulls. BTC retraced almost 35$ after making swing highs at $45,855. As this time BTC meets the buyers near $34,322 signaling bulls making a comeback and could push the asset back to the upside territory.
A daily close above the psychological $40,000 level would first capture the highs made on February 17 at $44,195.62 followed by a $48,000 horizontal line.
On the flip side, BTC still trades below the crucial 50-day and 200-day EMAs (Exponential Moving Average) at $41,529 and $45,847.64 respectively. Further, a failure to hold the session’s low could test the bullish slopping line at $36,220.
Technical indicators:
RSI: The Daily Relative Strength Index (RSI) reads at 46 with a neutral bias.
MACD: The Moving Average Convergence Divergence (MACD) hovers below the midline receding bearish momentum.
Play 10,000+ Casino Games at BC Game with Ease
- Instant Deposits And Withdrawals
- Crypto Casino And Sports Betting
- Exclusive Bonuses And Rewards


Why Trust CoinGape
CoinGape has covered the cryptocurrency industry since 2017, aiming to provide informative insights Read more…to our readers. Our journal analysts bring years of experience in market analysis and blockchain technology to ensure factual accuracy and balanced reporting. By following our Editorial Policy, our writers verify every source, fact-check each story, rely on reputable sources, and attribute quotes and media correctly. We also follow a rigorous Review Methodology when evaluating exchanges and tools. From emerging blockchain projects and coin launches to industry events and technical developments, we cover all facets of the digital asset space with unwavering commitment to timely, relevant information.

Related Articles


- Analyst Predicts Bitcoin Price Dip to $55K as ETFs See Outflows Amid Middle East Tensions
- Ethereum Co-founder Sparks $157M Sell-Off Fears as ETH Struggles Below $2k
- Analyst Predicts XRP Price Could Fall to $1 as XRP ETFs Record Net Weekly Outflows
- U.S.-Iran War: Trump Threatens to Hit Iran ‘Very Hard’ Today as Bitcoin Faces New Selling Pressure
- Crypto Market Weekly Recap: US-Iran War Steer Crypto Prices, Kraken Gets Fed Master Account, Tokenization Push March 2-6
- Dogecoin, Pepe coin, and Shiba Inu Price Prediction As BTC Crashes Below $70k
- Here’s Why Cardano Price Has Not Reclaimed $0.30
- Will XRP Price Crash as U.S. Nonfarm Payrolls Fell by 92,000 in February?
- Pi Network Price Eyes a 40% Surge as Pi Day Looms on March 14
- Top Reasons Why Circle Stock Price is Surging
- Gold Price Prediction as US-Iran War Hits the Second Week


