 Buy $GGs
Bitcoin, Ethereum Price Analysis Today: September 19th, 2022


The crypto market continues to bleed, pulling even the majority of cryptocurrencies to their 2022 low. As a result, the Bitcoin price has plunged to the July bottom support of $18600. Moreover, the Ethereum price plummeted to $1250 support, gradually nearing the $1000 psychological support.
Key points price analysis:
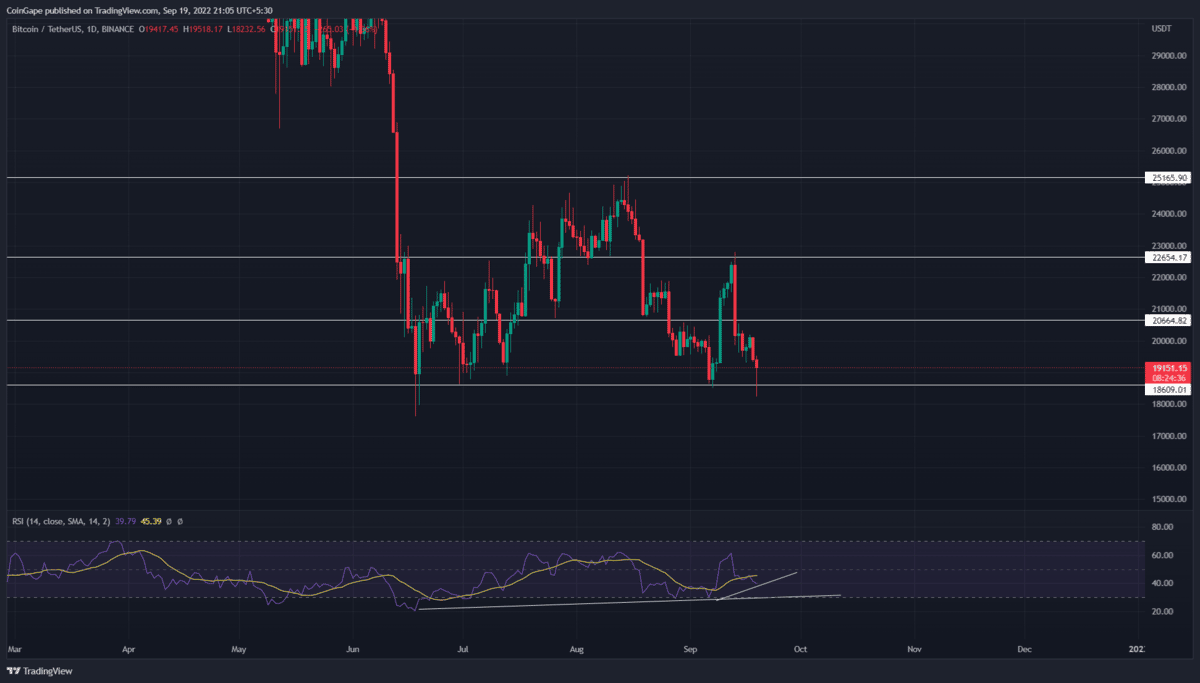
- The Bitcoin chart shows a double bottom pattern at $18800 support
- Amid ongoing correction, the Ethereum holder lost the monthly support of $1400
Bitcoin Holds Recovery Opportunity With A Bullish Reversal Pattern
 Source-Tradingview
The release of High CPI data triggered the ongoing correction in the Bitcoin price. As a result, the coin price reverted from $22500 and tumbled 17% since last week. Earlier today, the coin trader continued to face selling, and with a 5.7% intraday loss, the price retested the July bottom support of $18600.
However, the selling pressure has nearly evaporated by the press time, and the chart shows a long-wick Doji candle. Thus, a bullish signal candle at crucial support hints at a better possibility of price reversal. Furthermore, the potential breakout from the immediate resistance of $20800 will give additional confirmation for bullish recovery.
If this theory worked out, the Bitcoin price would form a double bottom pattern in the daily time frame chart. The neckline for this pattern is at $25000. For more information on trading this bullish pattern, read this article.
Relative strength index: the daily-RSI chart shows an evident bullish divergence to nearly every retest to the $18600 support in the past three months. Thus, divergence indicates growth in underlying bullish and an additional confirmation of bullish reversal.
Ethereum Price May Retest $1400 Resistance Before The Next Bear Cycle
 Source-Tradingview
For the same aforementioned reason, the Ethereum price lost 27.5% since last week and plunged to local support of $1280. However, during this downfall, the coin price breached the monthly support zone of $1400.
This breakdown should accelerate the bearish momentum and extend the ongoing correction to a deeper level
However, the daily chart shows a hammer candle at $1280, with a sufficient boost in volume. This reversal candle suggests the altcoin may rise higher and retest the $1400 mark as potential resistance.
If the selling pressure persists during this retest, the sellers may pull the prices below the $1280 support and plunge the price to $1000 support.
EMAs: the downsloping crucial EMAs(20, 50, 100, and 200) accentuate a downtrend in Ethereum price.
Play 10,000+ Casino Games at BC Game with Ease
- Instant Deposits And Withdrawals
- Crypto Casino And Sports Betting
- Exclusive Bonuses And Rewards


Why Trust CoinGape
CoinGape has covered the cryptocurrency industry since 2017, aiming to provide informative insights Read more…to our readers. Our journal analysts bring years of experience in market analysis and blockchain technology to ensure factual accuracy and balanced reporting. By following our Editorial Policy, our writers verify every source, fact-check each story, rely on reputable sources, and attribute quotes and media correctly. We also follow a rigorous Review Methodology when evaluating exchanges and tools. From emerging blockchain projects and coin launches to industry events and technical developments, we cover all facets of the digital asset space with unwavering commitment to timely, relevant information.

Related Articles


- Crypto Market Update: Top 3 Reasons Why BTC, ETH, XRP and ADA is Up
- Crypto News: Bitcoin Sell-Off Fears Rise as War Threatens Iran’s BTC Mining Operations
- U.S.–Iran War: Monday Crypto Crash Odds Rise As Pundits Predict Oil Price Spike
- US-Iran War: Reports Confirm Bombings In UAE, Bahrain and Kuwait As Crypto Market Makes Recovery
- XRP Price Dips on US-Iran Conflict, But Capitulation Signals March Rebound
- Bitcoin And XRP Price As US Kills Iran Supreme Leader- Is A Crypto Crash Ahead?
- Gold Price Prediction 2026: Analysts Expect Gold to Reach $6,300 This Year
- Circle (CRCL) Stock Price Prediction as Today is the CLARITY Act Deadline
- Analysts Predict Where XRP Price Could Close This Week – March 2026
- Top Analyst Predicts Pi Network Price Bottom, Flags Key Catalysts
- Will Ethereum Price Hold $1,900 Level After Five Weeks of $563M ETF Selling?


