 Buy $GGs
Bitcoin, Ethereum Price Prediction- These Patterns May Bolster BTC And ETH Bullish Rally


Bitcoin, Ethereum price prediction: The crypto market continues to remain sideways and faces uncertainty from market traders. At 10:32 am EST Monday, the global crypto market stood at $1.065 Trillion with a 0.65% loss from yesterday.
Furthermore, the total crypto market volume over the last 24 hours is $67.87 Billion, which makes a 17.87℅ loss. The total volume in DeFi is currently $3.28 Billion, 4.84% of the total crypto market 24-hour volume.
Top Gainers and Losers
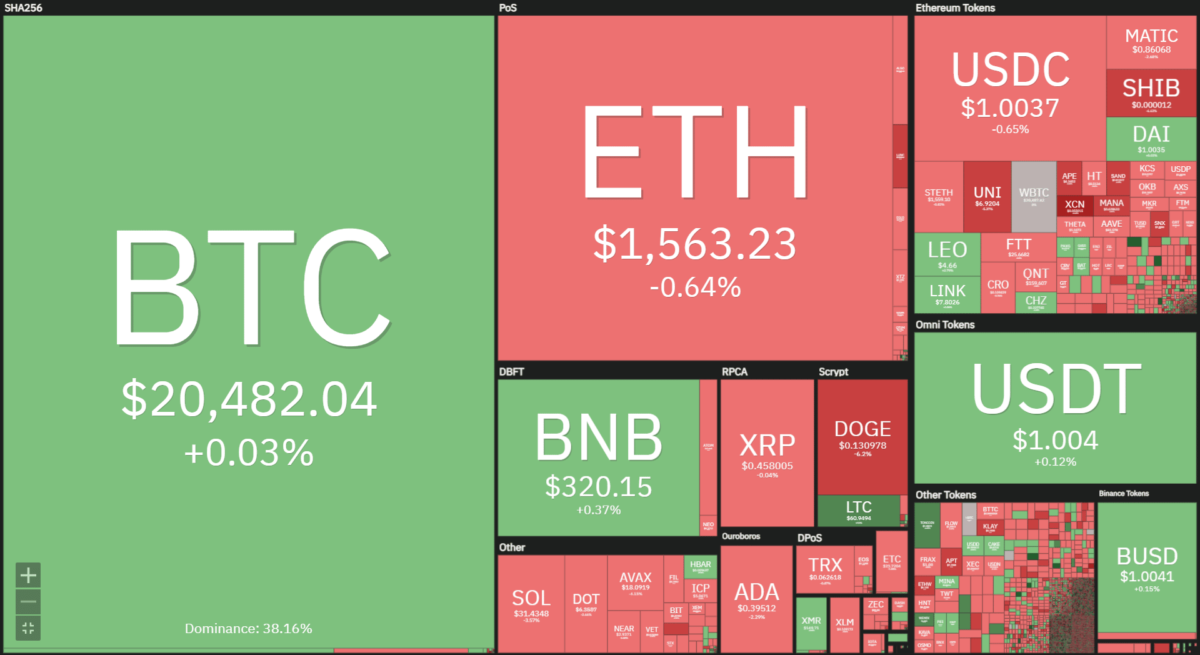 Source- Coin360
Among the top 100 cryptocurrencies, Litecoin and Basic Attention Token are the top gainers. Thus, the LTC price trades at $61.3 with a 12.1 gain in the last 24 hours, and the BAT price moves at $8.03, with a 6.44% jump. Conversely, the top losers are Chain and Aptos, where the XCN price exchanges hand at $0.0549, registering a 17.19% loss, while the APT price trades at $7.29 with a 7.95% fall.
Bitcoin Price
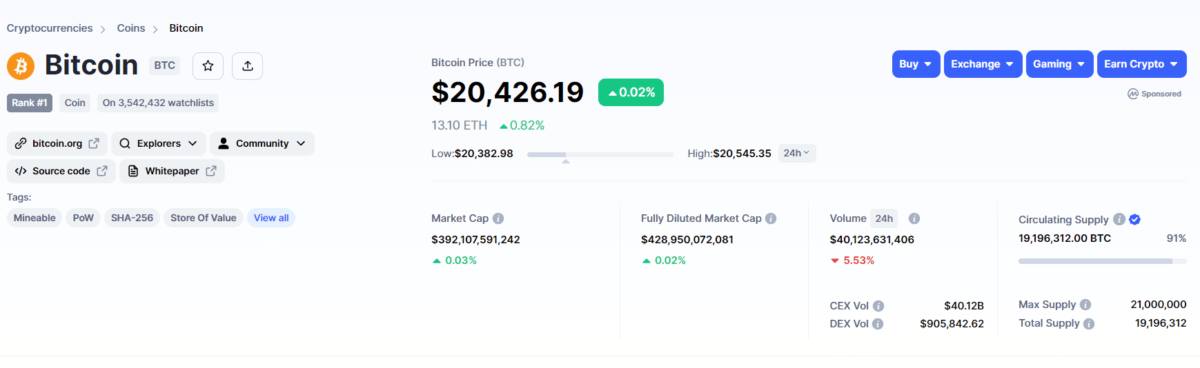 Source- Coinmarketcap
Following October’s 4th week of recovery, the Bitcoin price shifted on a lateral path. Since last week, the coin price has resonated between the $21000 and $20350 mark, creating a narrow range. In addition, the number of Doji candles at this resistance indicates uncertainty in market trends.
However, the 4-hour time frame chart offers insight into the possible outcome. This shorter time frame shows the formation of a descending triangle pattern. In theory, this bearish pattern could intensify the bearish momentum significantly. Currently, the Bitcoin price trades at $20420, with an intraday loss of 0.32%. Therefore, a breakdown below the $20350 neckline support could plunge the prices by 2% down to the $20000 mark.
 Source- Tradingview
On a contrary note, a bullish breakout from the resistance trendline will undermine the bearish thesis and assist buyers in surpassing $21000.
Ethereum Price
 Source- Coinmarketcap
In response to ongoing volatility in the crypto market, the Ethereum price showcases jerky movement short body daily candles. However, in the 4-hour, the uncertainty is reflected as a flag pattern. In theory, this pattern offers a short break period resuming the prior trend.
As of now, the Ethereum price trades at $1559, with an intraday loss of 1.21%. Thus, a bullish breakout of the overhead resistance will trigger the bullish contribution pattern and bolster buyers to overcome the $1640 mark.
 Source- Tradingview
The daily-RSI slope turned down from the overbought region accentuated the prices stabilizing from the previous rally.
Play 10,000+ Casino Games at BC Game with Ease
- Instant Deposits And Withdrawals
- Crypto Casino And Sports Betting
- Exclusive Bonuses And Rewards


Why Trust CoinGape
CoinGape has covered the cryptocurrency industry since 2017, aiming to provide informative insights Read more…to our readers. Our journal analysts bring years of experience in market analysis and blockchain technology to ensure factual accuracy and balanced reporting. By following our Editorial Policy, our writers verify every source, fact-check each story, rely on reputable sources, and attribute quotes and media correctly. We also follow a rigorous Review Methodology when evaluating exchanges and tools. From emerging blockchain projects and coin launches to industry events and technical developments, we cover all facets of the digital asset space with unwavering commitment to timely, relevant information.

Related Articles


- Crypto Prices Today: BTC, ETH, XRP Prices Surge Despite Iran’s Strait of Hormuz Closure
- Nasdaq Brings Prediction Markets to Wall Street with New SEC Filing
- Is the Bitcoin Price Correction Really Over or Is This a Bear Market Trap?
- ‘Gambling Is Not Investing’: New Group Pushes Crackdown on Prediction Markets
- XRP News: Ripple Prime to Move Post-Trade Activity to XRPL via NSCC Link
- Top 5 Historical Reasons Dogecoin Price Is Not Rising
- Pi Coin Price Prediction for March 2026 Amid Network Upgrade, KYC Boost, Rewards Distribution
- Gold Price Nears ATH; Silver Eyes $100 Breakout on Us- Iran War
- Bitcoin And XRP Price As US Kills Iran Supreme Leader- Is A Crypto Crash Ahead?
- Gold Price Prediction 2026: Analysts Expect Gold to Reach $6,300 This Year
- Circle (CRCL) Stock Price Prediction as Today is the CLARITY Act Deadline


