 Buy Presale
Bitcoin Price Analysis: BTC Holds Key Support At $21,300; Hold Or Exit?


Bitcoin price analysis implies an extended consolidation with a bearish bias. For the past few hours, the price is trading in green and is attempting to scale up to $21,750. The seller looks for fresh participation to roll down the price further.
BTC continues to harness a support zone after booking a single-day fall on August 19. However, the buyers should apply cautiousness as the price is still struggling below the $22,000 mark. This means there might be a struggle for BTC buyers and could hint at more pain ahead.
As of press time, BTC/USD is trading at $21,424, up 0.12% for the day. The 24-hour trading volume of the largest held at $32 billion with more than 8% gains.
- Bitcoin price consolidates for the third straight session.
- A daily close above $22,000 would make bulls hopeful.
- However, the momentum oscillators remain neutral.
Bitcoin price stabilizes before the big move
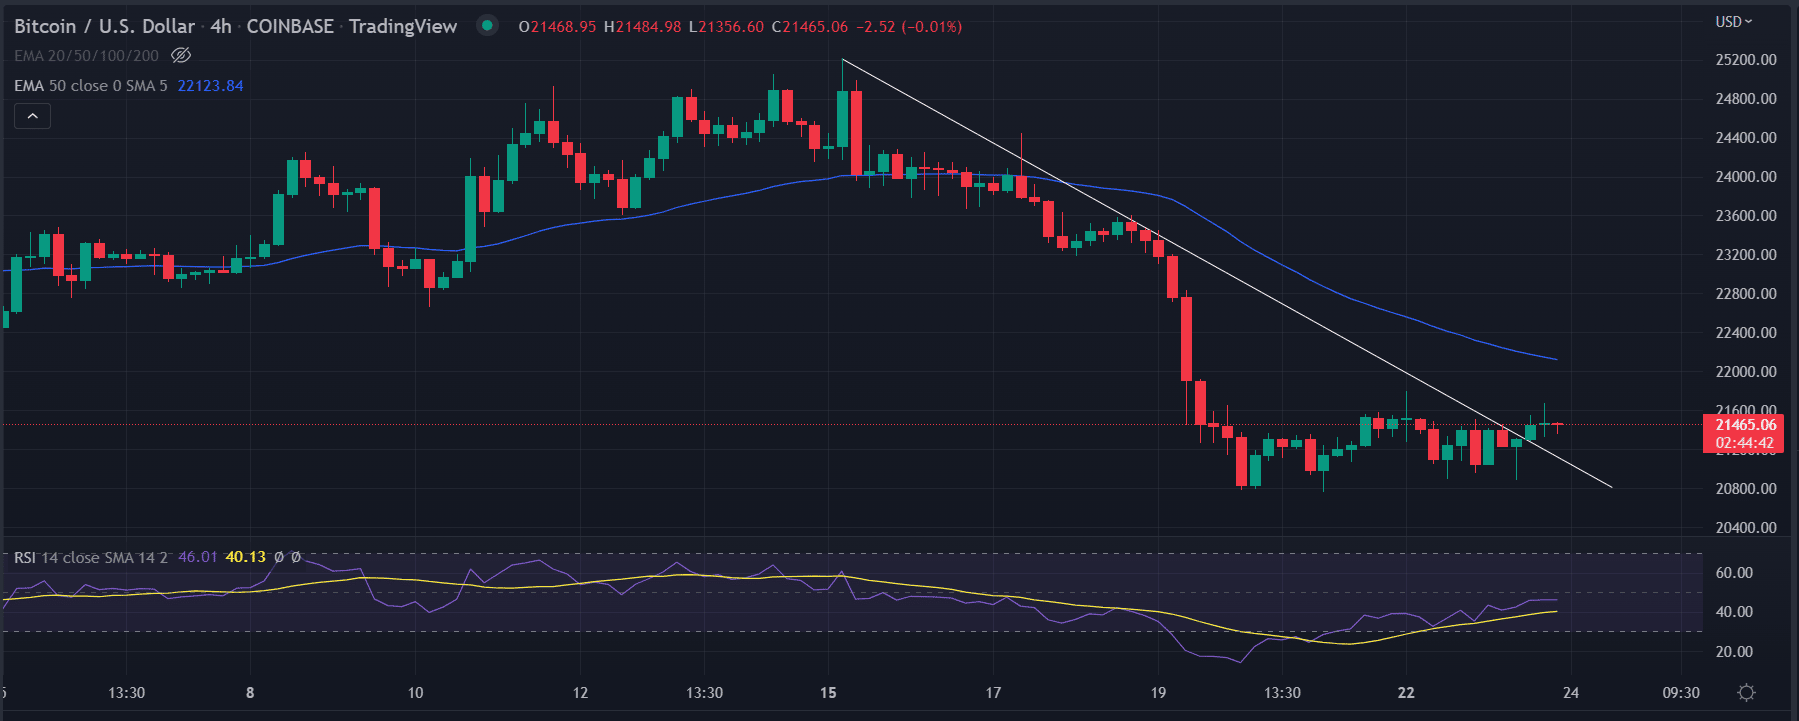
The Bitcoin price analysis on the 4-hour chart shows consolidation inside the bearish formation.
The descending trend line from the high of $25,214.57 made on August 15 acted as the resistance. The price faces rejection on August 18. A consolidation range of $20,800 and $21,800 is the current price structure.
BTC’s 50-hour exponential moving average is trending downwards and marking an upside barricade for the price. Despite the bearish sentiment exuded by the moving average, the formation of multiple Doji candlesticks indicates a short-term bounce back.
Further, the price dissects the downside trend line infusing some buying interest near the lower level.
The RSI shows positive divergence, meaning a recovery rally could be impeding. Currently, it reads at 44. Any uptick in the indicator would strengthen the upside outlook.
On moving higher, the bulls could reach out the 50-day EMA at $21,124.36. Next, market participants would explore $22,400.
On the other hand, a downside breakout of the range would intensify the selling pressure. In that case, the price could meet $20,400.
1-hour chart advocates for consolidation
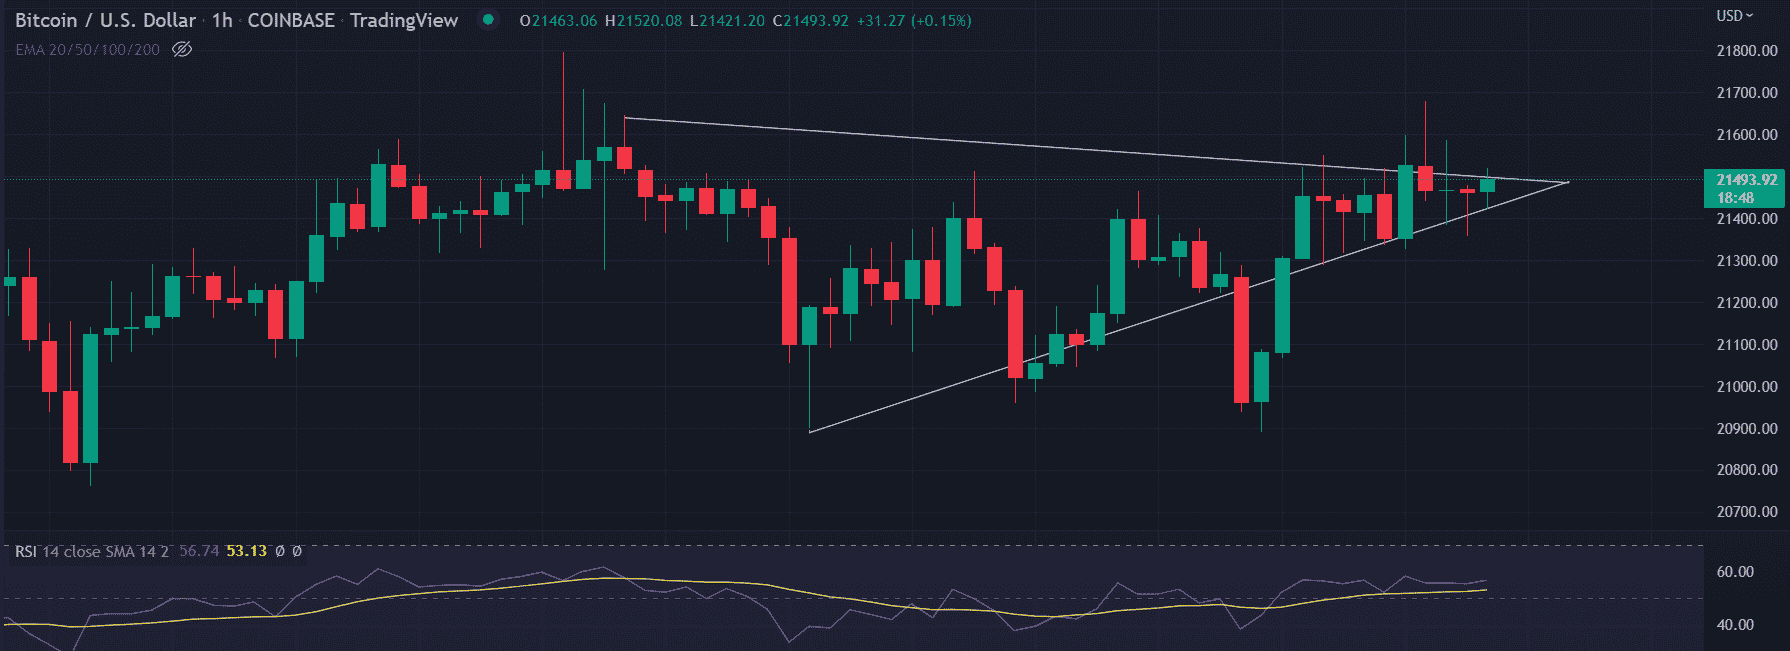
On the hourly time frame, BTC formed a ‘symmetrical triangle formation. It briefly dropped to test the low of $20,889.89 but recovered sharply. The price tested the intraday high of $21,679.42 and glides inside the converging trendline of the mentioned pattern.
We expect the Bitcoin price to thrash the upper trendline and scaled up to $21,700. Further, an hourly close above $21,800 would introduce additional buying pressure on the coin.
However, a trade below $21,300 in the hourly time frame would negate any possibilities for the bulls. We could see an immediate downside target at $21,000 followed by $20,800.
Play 10,000+ Casino Games at BC Game with Ease
- Instant Deposits And Withdrawals
- Crypto Casino And Sports Betting
- Exclusive Bonuses And Rewards


Why Trust CoinGape
CoinGape has covered the cryptocurrency industry since 2017, aiming to provide informative insights Read more…to our readers. Our journal analysts bring years of experience in market analysis and blockchain technology to ensure factual accuracy and balanced reporting. By following our Editorial Policy, our writers verify every source, fact-check each story, rely on reputable sources, and attribute quotes and media correctly. We also follow a rigorous Review Methodology when evaluating exchanges and tools. From emerging blockchain projects and coin launches to industry events and technical developments, we cover all facets of the digital asset space with unwavering commitment to timely, relevant information.

Related Articles


- Ripple Bets On AI Boom With Strategic Investment In AI Agent Infrastructure Startup
- Prediction Market News: Kalshi Fines MrBeast Associate Over Insider Trading Amid State Crackdown
- CLARITY Act: Banks, Crypto Yet To Agree On New Crypto Bill Draft As March 1 Deadline Looms
- Michael Saylor Predicts $50T From Bonds Could Flow Into Bitcoin Ecosystem as Digital Credit Evolves
- Bitcoin Treasury Firm GD Culture Authorizes Sale of 7,500 BTC as Expert Warns Of More ‘Pain’
- Dogecoin, Cardano, and Chainlink Price Prediction As Crypto Market Rebounds
- Will Solana Price Rally to $100 If Bitcoin Reclaims $72K?
- XRP Price Eye $2 Rebound as On-Chain Data Signals Massive Whale Accumulation
- Ethereum Price Reclaims $2K- New Rally Ahead or a Temporary Bounce?
- COIN Stock Price Prediction as Wall Street Pros Forecast a 62% Surge
- Cardano Price Signals Rebound as Whales Accumulate 819M ADA


