 Claim Card
Bitcoin Price Analysis: $BTC Price Sideways Action Edging Towards Bullish Breakout; Buy Today?


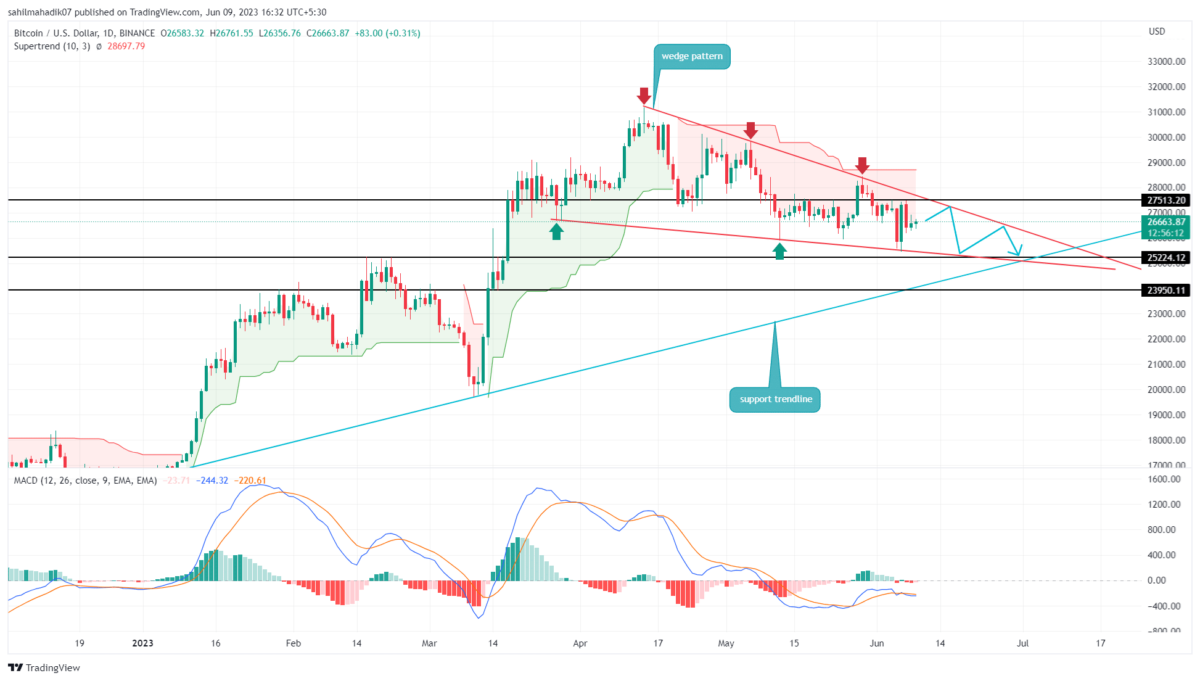
Bitcoin Price Analysis: The crypto market continues to witness a brawl between buyers and sellers but no clear indication of a directional trend. Thus, the largest cryptocurrency-Bitcoin may see a temporary consolidation, but the short-term downtrend is still intact. This downward trajectory is governed by a wedge pattern indicating the coin price could plunge lower before a significant upswing.
Also Read: Crypto Market Defies US SEC; Bitcoin, Ethereum, And Coinbase (COIN) Rally
Bitcoin Price Daily Chart
- The formation of a falling wedge pattern reflects a gradual decrease in bearish momentum.
- A breakout above the overhead resistance trendline is needed to trigger a bullish recovery.
- The intraday trading volume in Bitcoin is $12.2 Billion, indicating a 22% loss.
 Source-Tradingview
In the last few days, the buyers and sellers attempted to overthrow each other but failed to attain complete domination. Amid this uncertainty, it is valid to rely on short-term trends to determine the near future projection.
Under the influence of a falling wedge pattern, the Bitcoin price has witnessed a correction phase over the past months, constantly wobbling between two converging trendlines. Thus, until the pattern’s downsloping trendline is intact, the coin may see a further correction and could plunge to the $24000 mark this month.
On the flip side, buyers can rely on these two factors to maintain a bullish outlook first, the wedge pattern which is known as an uptrend continuation setup and could offer a considerable recovery upon the breakout of the resistance trendline.
Second, the long-coming support trendline can offer significant pullback opportunities.
Will Bitcoin Price Plunge to $24000?
If the broader market sentiment remains indecisive, the BTC price gradually slides to lower levels. The potential downfall will likely hit the next significant support at $25000, followed by $24000.
- Moving Average Convergence Divergence: Narrow swings and several crossovers between the MACD(blue) and signal(orange) line reflect current market uncertainty.
- Super trend: The red film projected by this daily indicator accentuates the bearish market trend.

Why Trust CoinGape
CoinGape has covered the cryptocurrency industry since 2017, aiming to provide informative insights Read more…to our readers. Our journal analysts bring years of experience in market analysis and blockchain technology to ensure factual accuracy and balanced reporting. By following our Editorial Policy, our writers verify every source, fact-check each story, rely on reputable sources, and attribute quotes and media correctly. We also follow a rigorous Review Methodology when evaluating exchanges and tools. From emerging blockchain projects and coin launches to industry events and technical developments, we cover all facets of the digital asset space with unwavering commitment to timely, relevant information.

Related Articles


- Expert Predicts Deeper Bitcoin Decline as JPMorgan CEO Warns of Similarities to the 2008 Financial Crisis
- Trump Won’t Pardon FTX’s Sam Bankman-Fried (SBF), White House Says
- Third Spot SUI ETF Goes Live as 21Shares Fund Launches on Nasdaq
- Mark Zuckerberg’s Meta Reportedly Eyes Stablecoin Integration This Year Amid Regulatory Clarity
- Coinbase Rivals Robinhood As It Rolls Out Stocks, ETFs Trading In ‘Everything Exchange’ Push
- Cardano Price Signals Rebound as Whales Accumulate 819M ADA
- Sui Price Eyes Recovery as Third Spot SUI ETF Debuts on Nasdaq
- Pi Network Price Eyes a 30% Jump as Migrations Jumps to 16M
- Will Ethereum Price Dip to $1,500 as Vitalik Buterin Continues Selling ETH?
- XRP Price Outlook as Clarity Act Passage Odds Plunge to 53%
- COIN Stock Risks Crashing to $100 as Odds of US Striking Iran Jump


