 Buy $GGs
Bitcoin Price Analysis: BTC Remains Pressured Below $22,000; Are You Holding?


Bitcoin price analysis shows the continuation of bearish sentiment. However, after testing the lows of in the previous week, the sellers look exhausted. As the price continues to sustain and move by 300 points. But the downside risk remained intact.
As of press time, BTC/USD is exchanging hands at $21,177, down 1.6% for the day. The 24-hour trading volume rose modestly at $25,471,533,584 as per the CoinMarketCap data. This is a sign that consolidation is happening at the lower levels.
- Bitcoin price started the fresh trading week on a lower note.
- A triple support formation of around $20,500 acted as a cushion for the price.
- The price consolidates in the range of $20,800 and $21,800.
Bitcoin price trades in a defined range
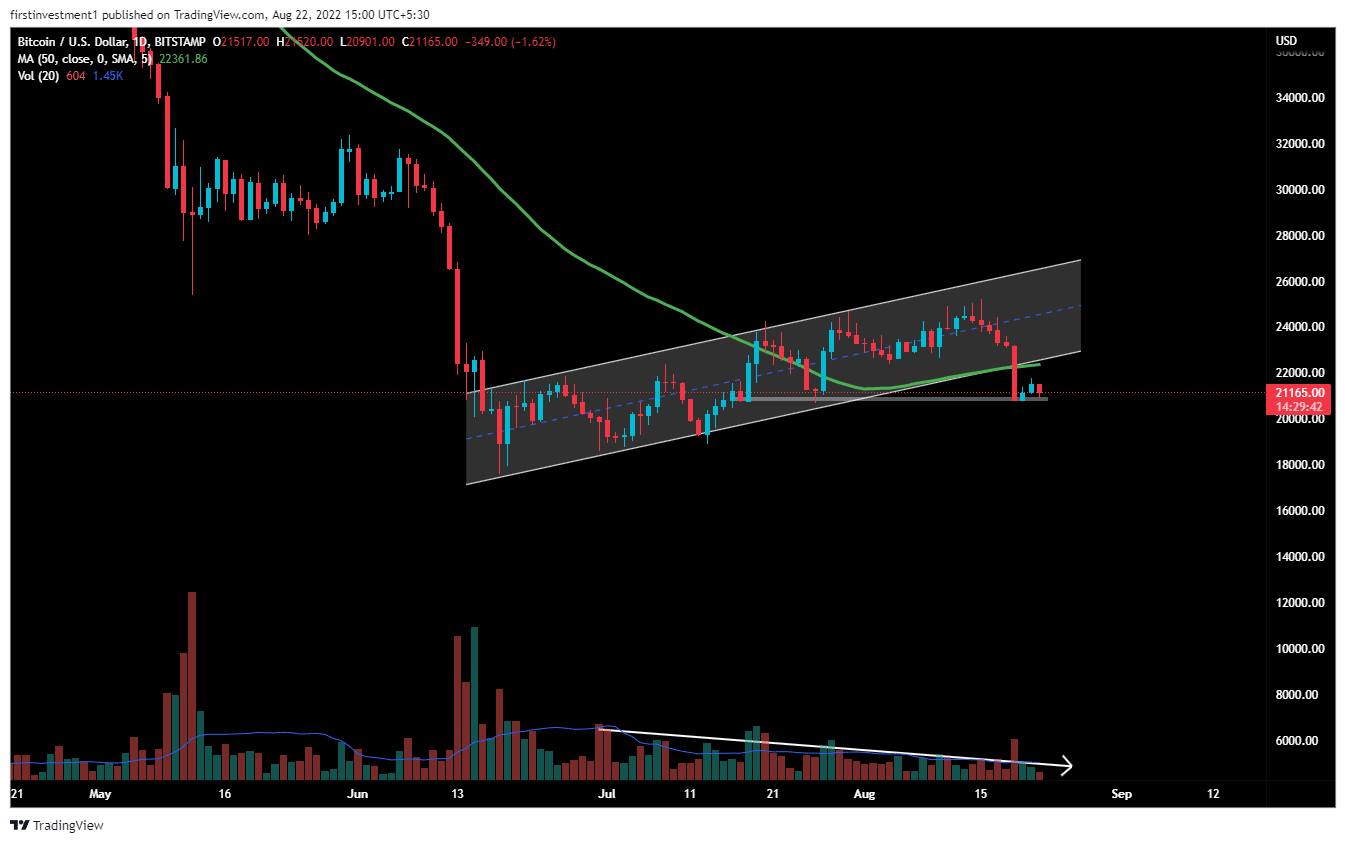
On the daily chart, the Bitcoin price analysis indicates a sideways movement with a bearish sentiment.
BTC traded in a bearish Flag & Pole pattern from June 15 to Aug 18. Recently, the price broke the pattern’s support level and gave a bearish breakdown. The breakout happened along with above-average volumes.
The volumes were declining in a channel, with the rising price, which implies decreasing participation by the buyers. When the market is rising while volume is declining, big money is not the one buying, more likely slowly exiting positions.
As per the analysis, the expected downside target could be around $19,500. To find targets for the Flag pattern, the Fibonacci extension indicator is used, which gives us more than 70% accurate targets.
As shown in the chart, the price has been in a downtrend for so long, making lower lows and lower highs. The price earlier gave a bearish impulse move from $32,375 to $17,650, after that for more than three months, the price takes a pullback to 50% Fibonacci retracement and started to fall after that from its recent highs of $25,000, which also acts as a psychological level.
Further, the Bitcoin price broke the 50-day exponential moving average & is sustaining below that level. If the price breaks the recent low ($20,780), then we can expect a sharp fall in the short term.
The nearest support is $20,780, whereas the most immediate resistance is found near $22,380. There is a higher probability of the downside break.
On the other hand, a break above the $21,500 level could invalidate the bearish outlook. If that occurs, the first upside target could be $22,000 followed by $22,700.
BTC is bearish on all time frames. Below $20,780 closing on the hourly time frame, we can put a trade on the sell side.
Play 10,000+ Casino Games at BC Game with Ease
- Instant Deposits And Withdrawals
- Crypto Casino And Sports Betting
- Exclusive Bonuses And Rewards


Why Trust CoinGape
CoinGape has covered the cryptocurrency industry since 2017, aiming to provide informative insights Read more…to our readers. Our journal analysts bring years of experience in market analysis and blockchain technology to ensure factual accuracy and balanced reporting. By following our Editorial Policy, our writers verify every source, fact-check each story, rely on reputable sources, and attribute quotes and media correctly. We also follow a rigorous Review Methodology when evaluating exchanges and tools. From emerging blockchain projects and coin launches to industry events and technical developments, we cover all facets of the digital asset space with unwavering commitment to timely, relevant information.

Related Articles


- Crypto Market Update: Top 3 Reasons Why BTC, ETH, XRP and ADA is Up
- Crypto News: Bitcoin Sell-Off Fears Rise as War Threatens Iran’s BTC Mining Operations
- U.S.–Iran War: Monday Crypto Crash Odds Rise As Pundits Predict Oil Price Spike
- US-Iran War: Reports Confirm Bombings In UAE, Bahrain and Kuwait As Crypto Market Makes Recovery
- XRP Price Dips on US-Iran Conflict, But Capitulation Signals March Rebound
- Bitcoin And XRP Price As US Kills Iran Supreme Leader- Is A Crypto Crash Ahead?
- Gold Price Prediction 2026: Analysts Expect Gold to Reach $6,300 This Year
- Circle (CRCL) Stock Price Prediction as Today is the CLARITY Act Deadline
- Analysts Predict Where XRP Price Could Close This Week – March 2026
- Top Analyst Predicts Pi Network Price Bottom, Flags Key Catalysts
- Will Ethereum Price Hold $1,900 Level After Five Weeks of $563M ETF Selling?


