
Bitcoin Price Analysis: Bull Traps Puts $BTC Price at Risk of Prolong Correction


Affected by the massive growth of the 5th largest cryptocurrency XRP, the leading coin Bitcoin witnessed intense buying pressure on July 13th. With a strong bullish candle, the buyers breached the range resistance of $31500, luring awaited buyers for the potential of uptrend continuation. However, the buyers could sustain higher prices which lead to a massive red undermining the bullish thesis. What’s next?
Also Read: Bitcoin (BTC) Set For $35000, Ethereum (ETH) Above $2000 As US CPI Inflation Falls
Bitcoin Price Daily Chart
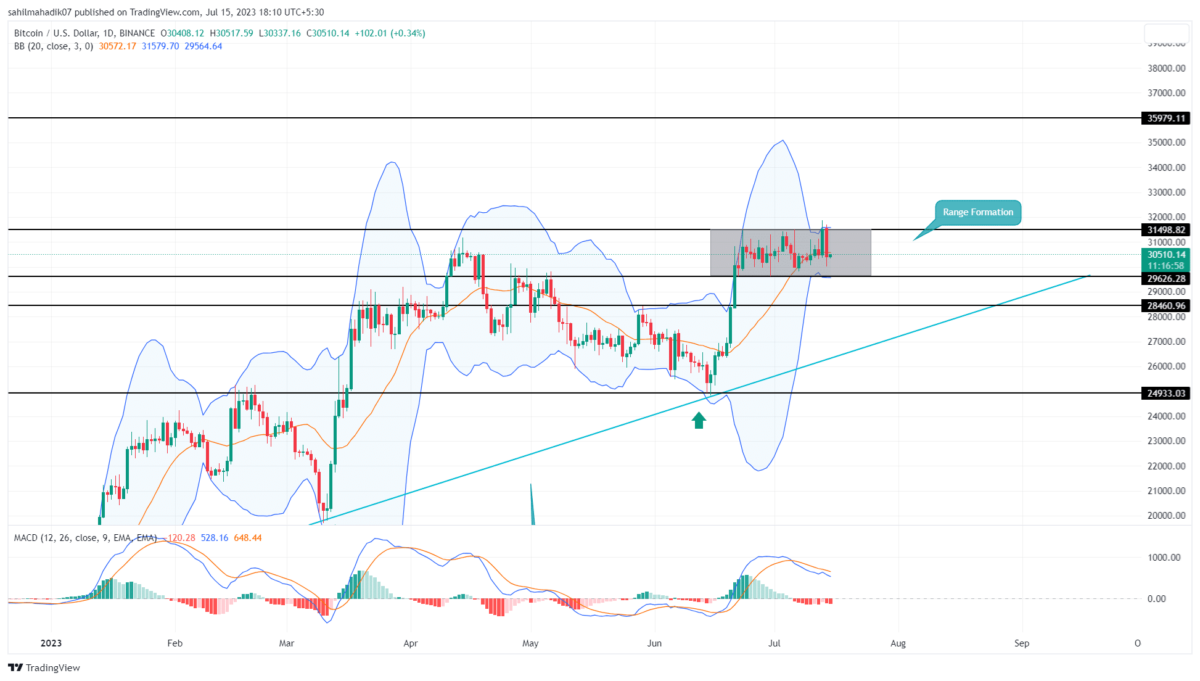
- The $31500 level persists as a strong resistance zone for the BTC price.
- The 20-day EMA dynamic support maintains a high momentum recovery
- The intraday trading volume in Bitcoin is $17.3 Billion, indicating a 34% loss.
 Source-Tradingview
On July 14th, the Bitcoin price projected a long red candle that engulfed the buyer’s candle used to break the $13500 barrier. The sellers’ candles destroyed buyers’ weapons of breakout indicating a scenario of a bull trap which may flood more supply pressure as hasty buyers may get liquidated.
Thus, the coin price reenters the range boundaries stretched from $31500 to $29630. The Bitcoin price currently trades at $30461, but with sustaining selling it could plunge 2.75% to reach $29630 support
The price behavior at the aforementioned support would be crucial to check whether the prevailing recovery is intact, or whether BTC could witness a longer correction to $28460.
[converter id=”btc-bitcoin” url=”https://coingape.com/price/converter/btc-to-usd/”]
When BTC Price Can Escape the Sideways Trend?
The fake breakout from $31500 accentuated this level as a high supply zone. On the other hand, if the BTC price showed sustainability above $29630 in the coming days, the coin holders could witness a prolonged sideways trend. Therefore, a genuine breakout from either of the range pattern is needed to determine the near future trend for Bitcoin.
- Bollinger Bands: The upper and lower band of the BB indicator aligned with range levels gives extra weightage to them.
- Moving Average Convergence Divergence: The MACD indicator slope in a negative crossover state indicates the sellers actively influencing the Bitcoin price.

Why Trust CoinGape
CoinGape has covered the cryptocurrency industry since 2017, aiming to provide informative insights Read more…to our readers. Our journal analysts bring years of experience in market analysis and blockchain technology to ensure factual accuracy and balanced reporting. By following our Editorial Policy, our writers verify every source, fact-check each story, rely on reputable sources, and attribute quotes and media correctly. We also follow a rigorous Review Methodology when evaluating exchanges and tools. From emerging blockchain projects and coin launches to industry events and technical developments, we cover all facets of the digital asset space with unwavering commitment to timely, relevant information.


- 3 Top Reasons Why Coinbase Stock is Sliding Today?
- Bernstein Says Bitcoin Has Bottomed Even as U.S.-Iran Peace Talks Remain Uncertain
- Monero Privacy Demand Hits Record Highs: How GhostSwap Is Meeting the BTC to XMR Surge
- Goldman Sachs Defies Oil Surge with Bold 2026 Fed Rate Cut Forecast
- Bitcoin Risks Fall as US-Israel Strikes Iran’s Energy Facilities Despite Trump’s 5-Day Pause
- Dogecoin, Shiba Inu, and Pepe Coin Price Outlook as Markets Rise on U.S.–Iran Temporary Pause
- Bittensor (TAO) Price Soars 80% MoM Outperforming Bitcoin- Is It A Good Time to Buy?
- Top Factors Behind Shiba Inu (SHIB) Price Surging Today
- Gold Vs BTC: Bitcoin Outperforms Gold by 23% – Is $75K Next Amid Trump’s Five Day Pause
- Crypto Stocks to Watch As Trump Issues 48-Hour Iran Ultimatum- CRCL, COIN, and MSTR Price Analysis
- XRP Price Prediction Ahead of March 27 SEC Spot ETF Decision


