 Buy $GGs
Bitcoin Price Analysis: Can $BTC Bulls Defend $26000 Support? Experts Predict “No”


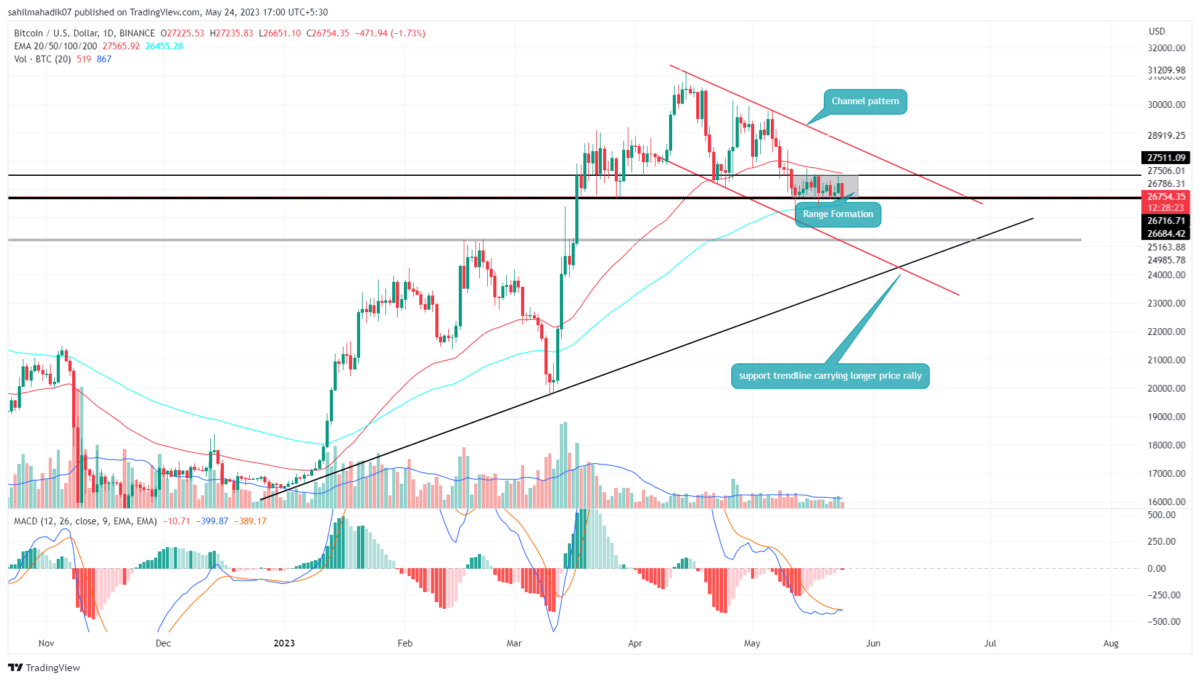
Bitcoin price has extended its choppy behavior for over two weeks now, keeping the overall market sentiment uncertain. Any attempts from buyers or sellers are getting rejected and therefore, the BTC price has remained in a fixed range stretched from $27500 and $26684. It is better for new traders not to enter into such volatile price action and wait for a clear breakout.
Also Read: Bitcoin (BTC) Sell Side Risk Ratio At All-Time Low, Big Moves Ahead
Bitcoin Price Daily Chart
- The range between $27500 and $26684 stands as a no-trading zone.
- A breakout from either side of the range may give suitable confirmation of a potential trend.
- The intraday trading volume in Bitcoin is $12.5 Billion, indicating a 10.4% loss.
 Source-Tradingview
BTC price witnessed a significant downtick today and registered a 1.7% intraday loss. The coin price currently exchanges hands at $26754 and showed a breakdown attempt from the aforementioned range support of $26684.
A breakdown below $26684 with daily candle closing would result in Bitcoin price sliding to the next significant support of $25265-$25171, registering a potential loss of 6%. However, the BTC price may remain bullish in the long term until the long-coming support trendline(black) is intact.
On a contrary note, a breakout above the range resistance of $27500 will trigger a short rally of around 3% to hit the overhead trendline near $28200.
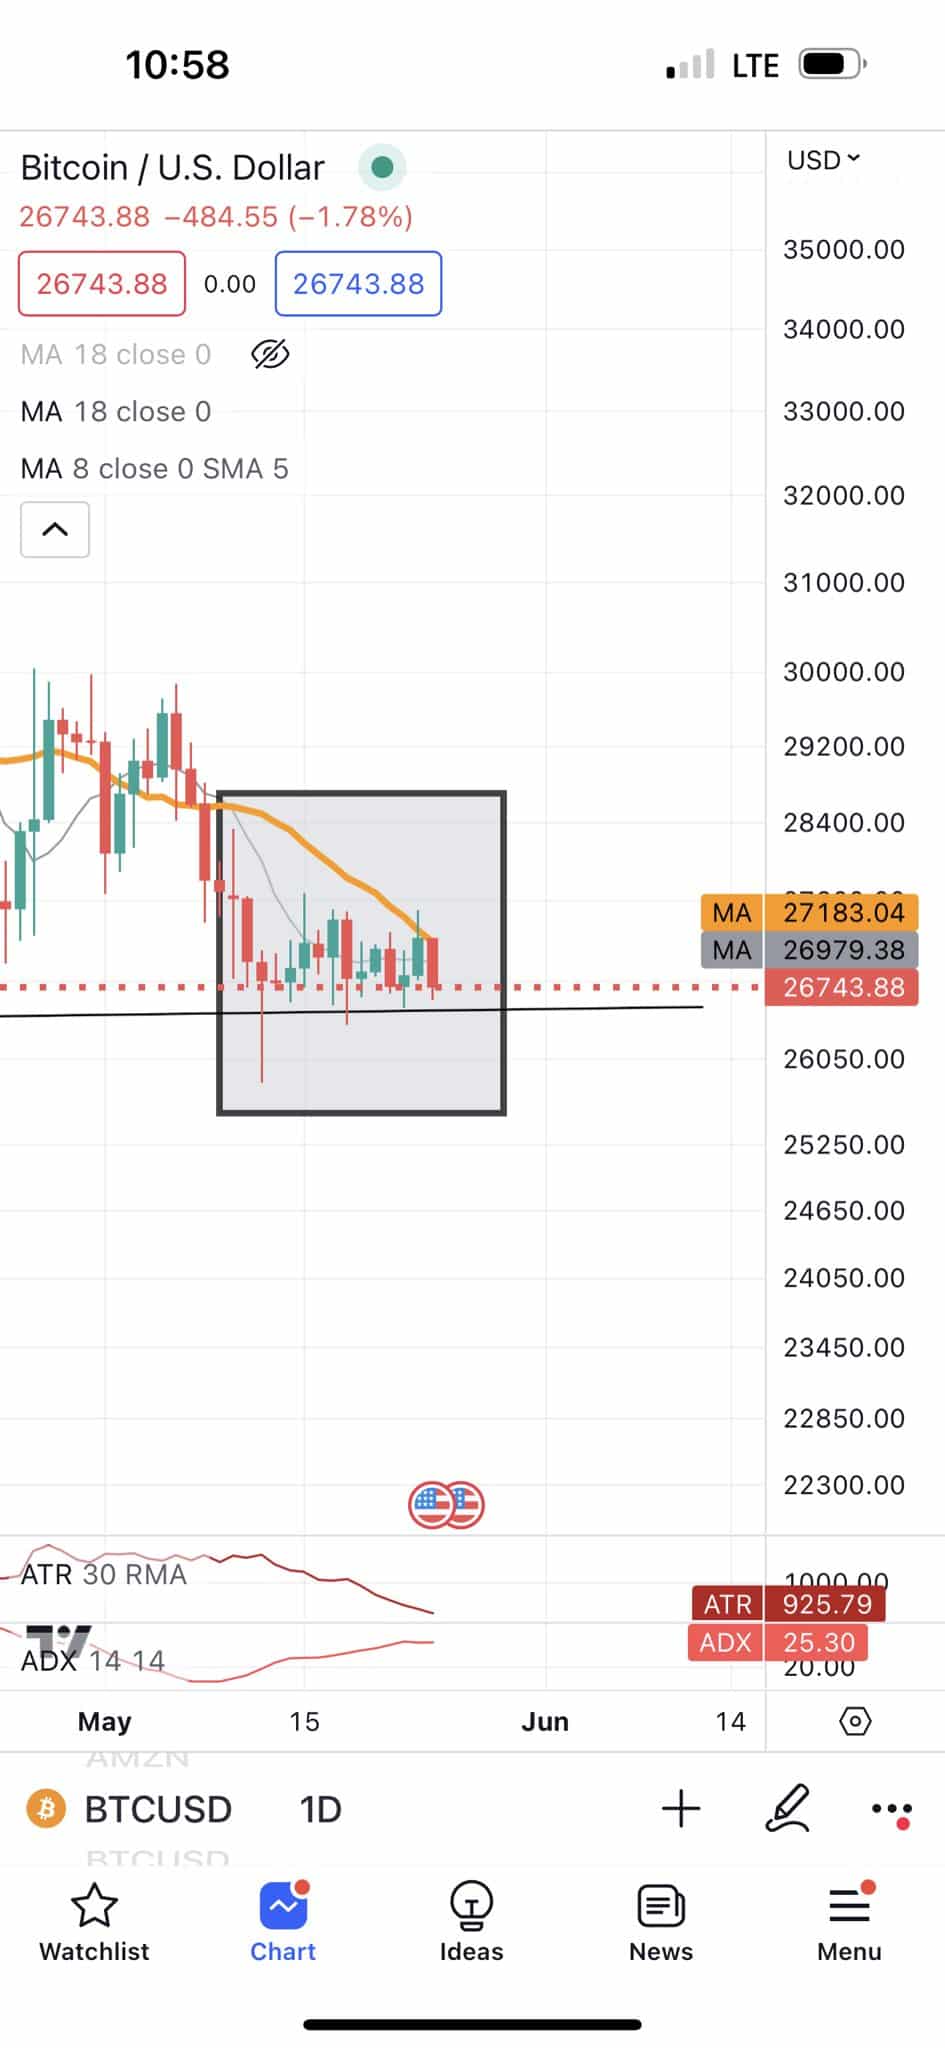
Will Bitcoin Price Hold At $26000?
The Bitcoin price is actively taking support at the $26684 level preventing the sellers from extending the current correction phase to the lower levels. However, if the market sentiment shows no improvement a breakdown below the aforementioned will cause a sharp fall below $26000.
- Exponential Moving Average: The 50-day EMA slope moving close to the range resistance of $27500 and 100-day EMA $26684 support accentuates the importance of these chart levels.
- Moving Average Convergence Divergence: The MACD(Blue) and signal(orange) lines went flattish below the neutral line highlighting an indecisive price movement amid a longer downtrend.
Experts Predict Short Term Downfall For BTC Price
As Coingape reported, renowned trader Peter Brandt identified the ongoing consolidation in Bitcoin price as a famous bearish pattern called Flag/pennant.
Under the influence of this bearish setup, the coin price is likely to witness a significant downfall. The bearish thesis will get invalidated if the BTC price closes above the mid-swing top.
Play 10,000+ Casino Games at BC Game with Ease
- Instant Deposits And Withdrawals
- Crypto Casino And Sports Betting
- Exclusive Bonuses And Rewards


Why Trust CoinGape
CoinGape has covered the cryptocurrency industry since 2017, aiming to provide informative insights Read more…to our readers. Our journal analysts bring years of experience in market analysis and blockchain technology to ensure factual accuracy and balanced reporting. By following our Editorial Policy, our writers verify every source, fact-check each story, rely on reputable sources, and attribute quotes and media correctly. We also follow a rigorous Review Methodology when evaluating exchanges and tools. From emerging blockchain projects and coin launches to industry events and technical developments, we cover all facets of the digital asset space with unwavering commitment to timely, relevant information.

Related Articles


- Peter Brandt Flips Bullish, Predicts Bitcoin Rally As Price Holds Above $70k
- XRP News: Institutional Use Case Expands as Doppler Finance Integrates WXRP for Multi-Chain Access
- Trump Tariffs: Bitcoin Faces Fresh Headwinds as 15% Global Tariffs Begin This Week Amid Iran War
- Bitget Unveils ‘Crypto Anti-Bias Pledge’ To Support Women’s Inclusion In Crypto
- U.S.-Iran War: Crypto Market Rebounds as Iran Reportedly Reaches Out To U.S. To End Conflict
- Dogecoin Price Outlook as BTC Recovers Above $73,000
- XRP Price Prediction as Iran-U.S. Peace Talks Trigger a Crypto Rally
- COIN Stock Analysis as Bitcoin Retests $72k Ahead of February NFP Data
- Robinhood Stock Price Prediction As Cathie Wood Buys $12M Dip in Bold ARK Move
- Bitcoin Price At Risk? Professor Who Predicted US-Iran War Says America Could Lose
- Gold Price Prediction March 2026: Rally, Crash, or Record Highs?


