Bitcoin Price Analysis: Can BTC Revisit $22,000 After Heavy Sell-Off?


Bitcoin price analysis indicates a minor pullback following a single day’s biggest fall since June 13. The price is currently trading near $21,300 and is managed to pause the further fall. BTC is still struggling to break above the resistance of $21,600.
After the recent consolidation, the price breaks down on the lower side evaporating the latest gains. A break below $20,000 could set the next cycle of sell-side run down. The massive sell-off in the previous session is showing that the bears have the upper hand.
The consolidation near the higher levels reflects that big players were not participants as can be seen with the decline in volumes. As the bulls look exhausted the rally fizzled out and faces strong resistance above $25,000.
As of publication time, BTC/USD is exchanging hands at $21,211.78, up 1.74% for the day. The largest cryptocurrency by market cap held the 24-hour trading volume at $29,298,822,666 with a loss of more than 19%.
- Bitcoin price manages to reclaim a part of the previous session loss.
- However, the downside risk remains intact below $23,000.
- All momentum oscillator favors bearish sentiment.
Bitcoin price looks for stability
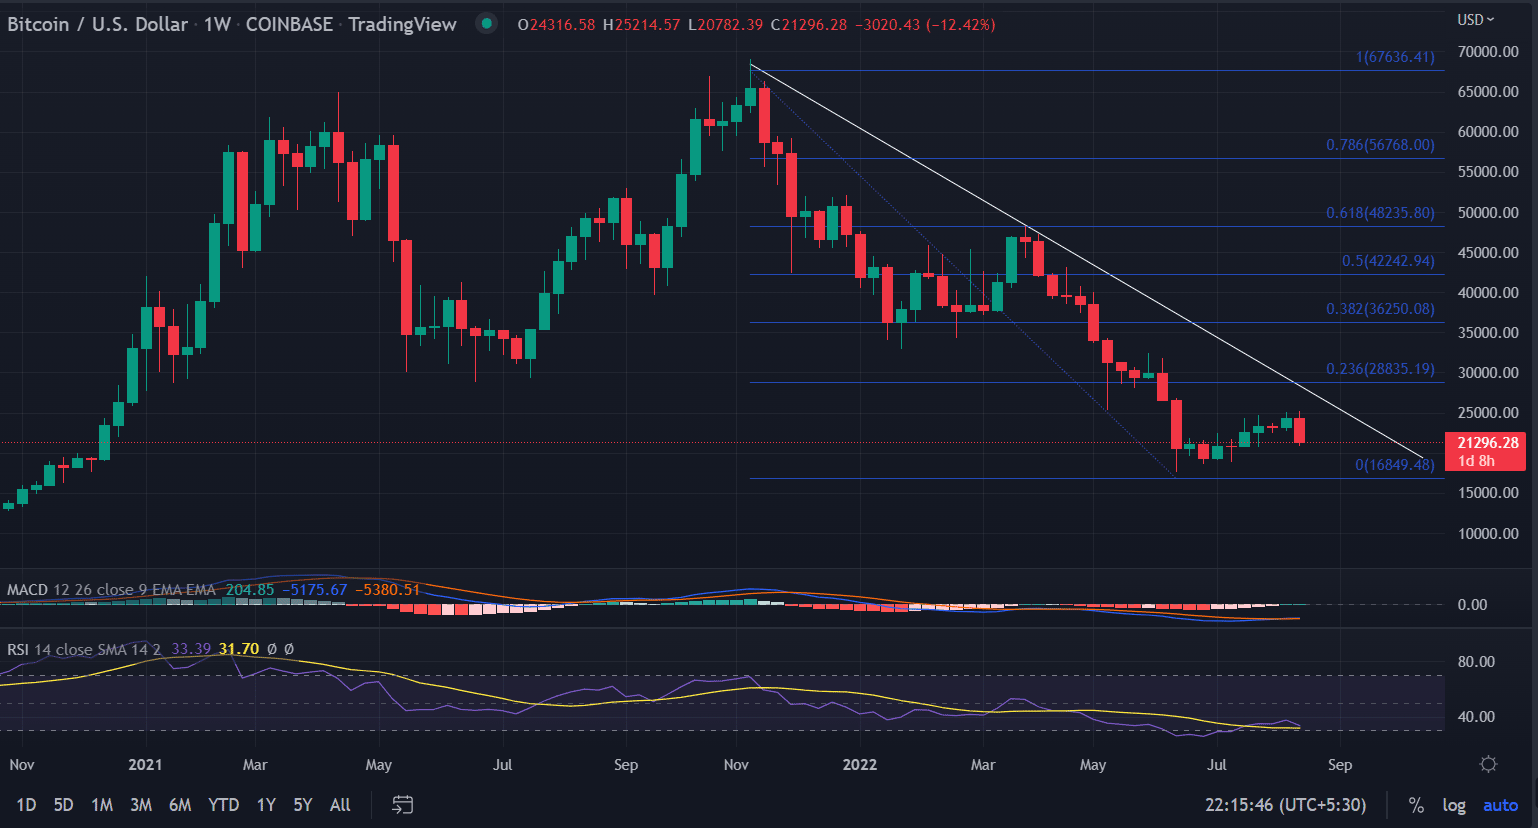
On the weekly chart, the Bitcoin price analysis shows the continuation of the long-term downside momentum if certain conditions are met.
The bearish trend line from the highs of $69,000 acts as a strong resistance barrier for the bulls. Bulls attempted thrice to breach the bearish trend line but failed to do so. However, the price consolidates for a month near the support zone extending from $17,000 to $20,000. Thus, making it a crucial trading zone.
BTC appreciated nearly 45% from the lows of $17,567.45 to the swing high of $25,214.57.
The price completed a complete Fibonacci retracement and is currently struggling below 0.23% Fibo. retracement.
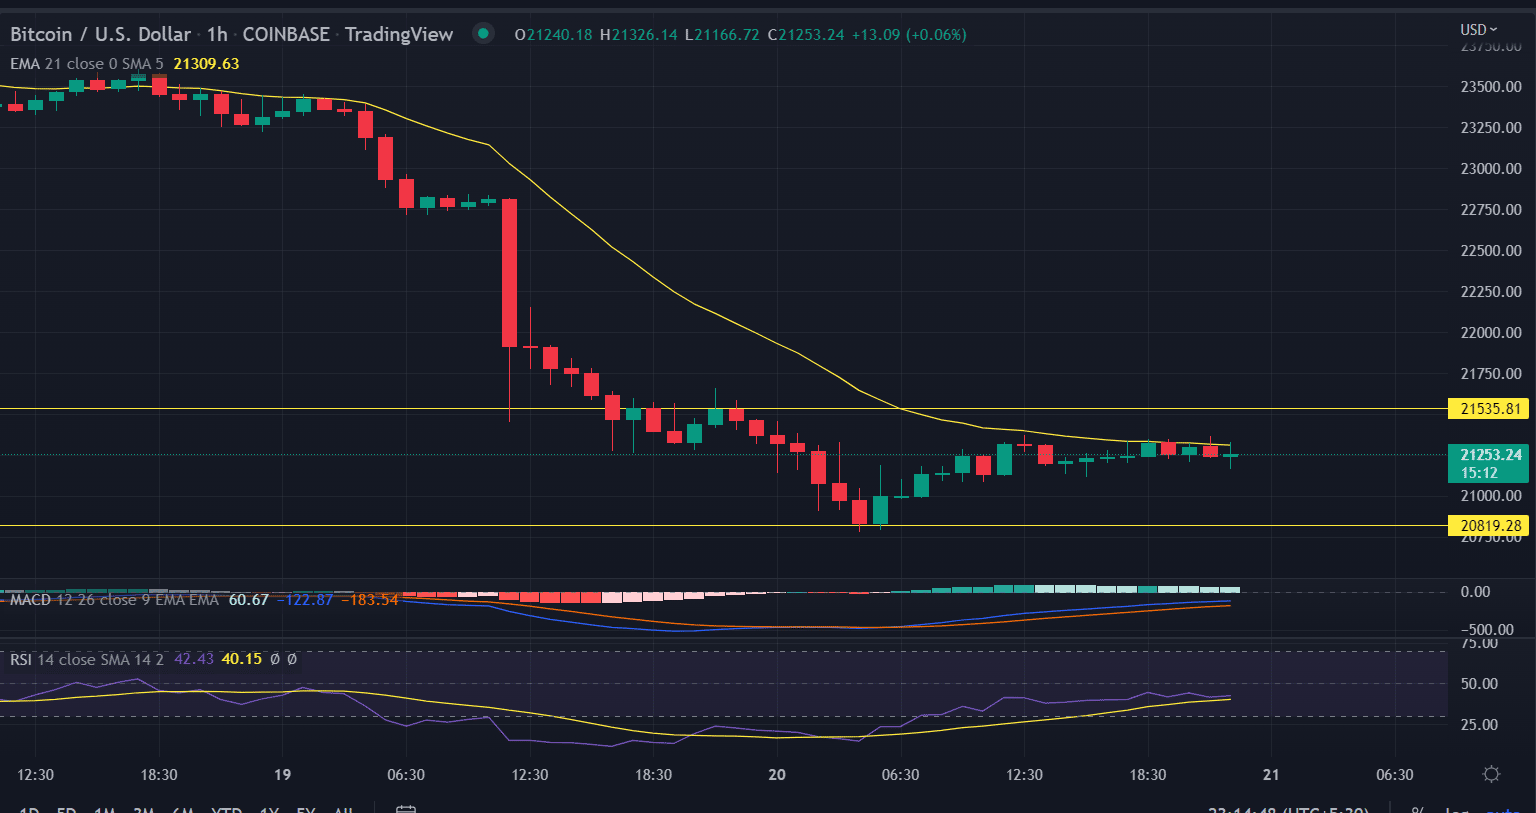
On the hourly chart, BTC slipped below the 21-day exponential moving average (EMA) as the trading week began.
After falling sharply in the previous session, the price consolidates near the $20,000 mark and made a sharp bounce back above $21,200.
Also read: Satoshi vs. the State of Idaho: Discrimination Against Bitcoin Mining?
However, the price still remains pressured below the moving average, indicating the presence of the sellers. At this point in time, every bounce is a selling opportunity.
A move above $21,500 on the hourly time frame could fuel further upside movement in the coin. If that happens, the first upside target could be found at $22,000 followed by $22,400.
MACD: The Moving Average Convergence Divergence is still below the midline with rising bullish momentum.
RSI: The RSI holds above the average line. It currently reads at 40.

Why Trust CoinGape
CoinGape has covered the cryptocurrency industry since 2017, aiming to provide informative insights Read more…to our readers. Our journal analysts bring years of experience in market analysis and blockchain technology to ensure factual accuracy and balanced reporting. By following our Editorial Policy, our writers verify every source, fact-check each story, rely on reputable sources, and attribute quotes and media correctly. We also follow a rigorous Review Methodology when evaluating exchanges and tools. From emerging blockchain projects and coin launches to industry events and technical developments, we cover all facets of the digital asset space with unwavering commitment to timely, relevant information.

Related Articles


- Why Is Bitdeer Stock Price Dropping Today?
- Breaking: U.S. Supreme Court Strikes Down Trump Tariffs, BTC Price Rises
- Breaking: U.S. PCE Inflation Rises To 2.9% YoY, Bitcoin Falls
- BlackRock Signals $270M Bitcoin, Ethereum Sell-Off as $2.4B in Crypto Options Expire
- XRP News: Dubai Tokenized Properties Trading Goes Live on XRPL as Ctrl Alt Advances Project
- Ethereum Price Rises After SCOTUS Ruling: Here’s Why a Drop to $1,500 is Possible
- Will Pi Network Price See a Surge After the Mainnet Launch Anniversary?
- Bitcoin and XRP Price Prediction As White House Sets March 1st Deadline to Advance Clarity Act
- Top 3 Price Predictions Feb 2026 for Solana, Bitcoin, Pi Network as Odds of Trump Attacking Iran Rise
- Cardano Price Prediction Feb 2026 as Coinbase Accepts ADA as Loan Collateral
- Ripple Prediction: Will Arizona XRP Reserve Boost Price?


