 Buy $GGs
Bitcoin Price Analysis: Is Recovery Above $23,000 Sustainable Amid Low Volumes?


Bitcoin price analysis shows recovery from the lower levels in today’s session. The price manages to buck the five-session of losses and is trading higher. However, below the average volume implies that the market needs more conviction to place aggressive bids in the largest crypto current by the market cap. Institutional buyers are not participating much in the recent trading action.
A softer U.S dollar and mixed equities supported the move in the coin. The BTC price reversed from the session’s high indicating some pressure or the requirement of impulse buying to maintain the gains. Still, the daily chart analysis suggests BTC buyers would be on the front foot in the near term.
- BTC price prints fresh gains on Friday following a period of consolidation.
- The price faces a resistance hurdle at the 50-day EMA, a decisive break would bring more gains.
- The momentum oscillator remains neutral and warns of aggressive bids.
Will rebound in BTC sustains?
Bitcoin price edges higher on Friday coming out of the previous few sessions of consolidation. After rising from the lows of $18,892, the BTC price entered into a corrective pullback every time it tested the swing high. In the same pattern, after the recent swing high of $24,666 made on July 30, BTC faced pullback as the price lost steam. However, this would allow BTC to rise in a healthy manner.
At the time of writing, the BTC price paused the gains near the daily resistance zone of around $23,200-$23,400. For BTC to continue with its currency momentum it must break and hold above this resistance zone on the daily basis. If that happens, the price will likely break the $24,200 horizontal resistance zone and potentially go on to surge past $25,500
Daily-chart analysis shows signs of upside extension
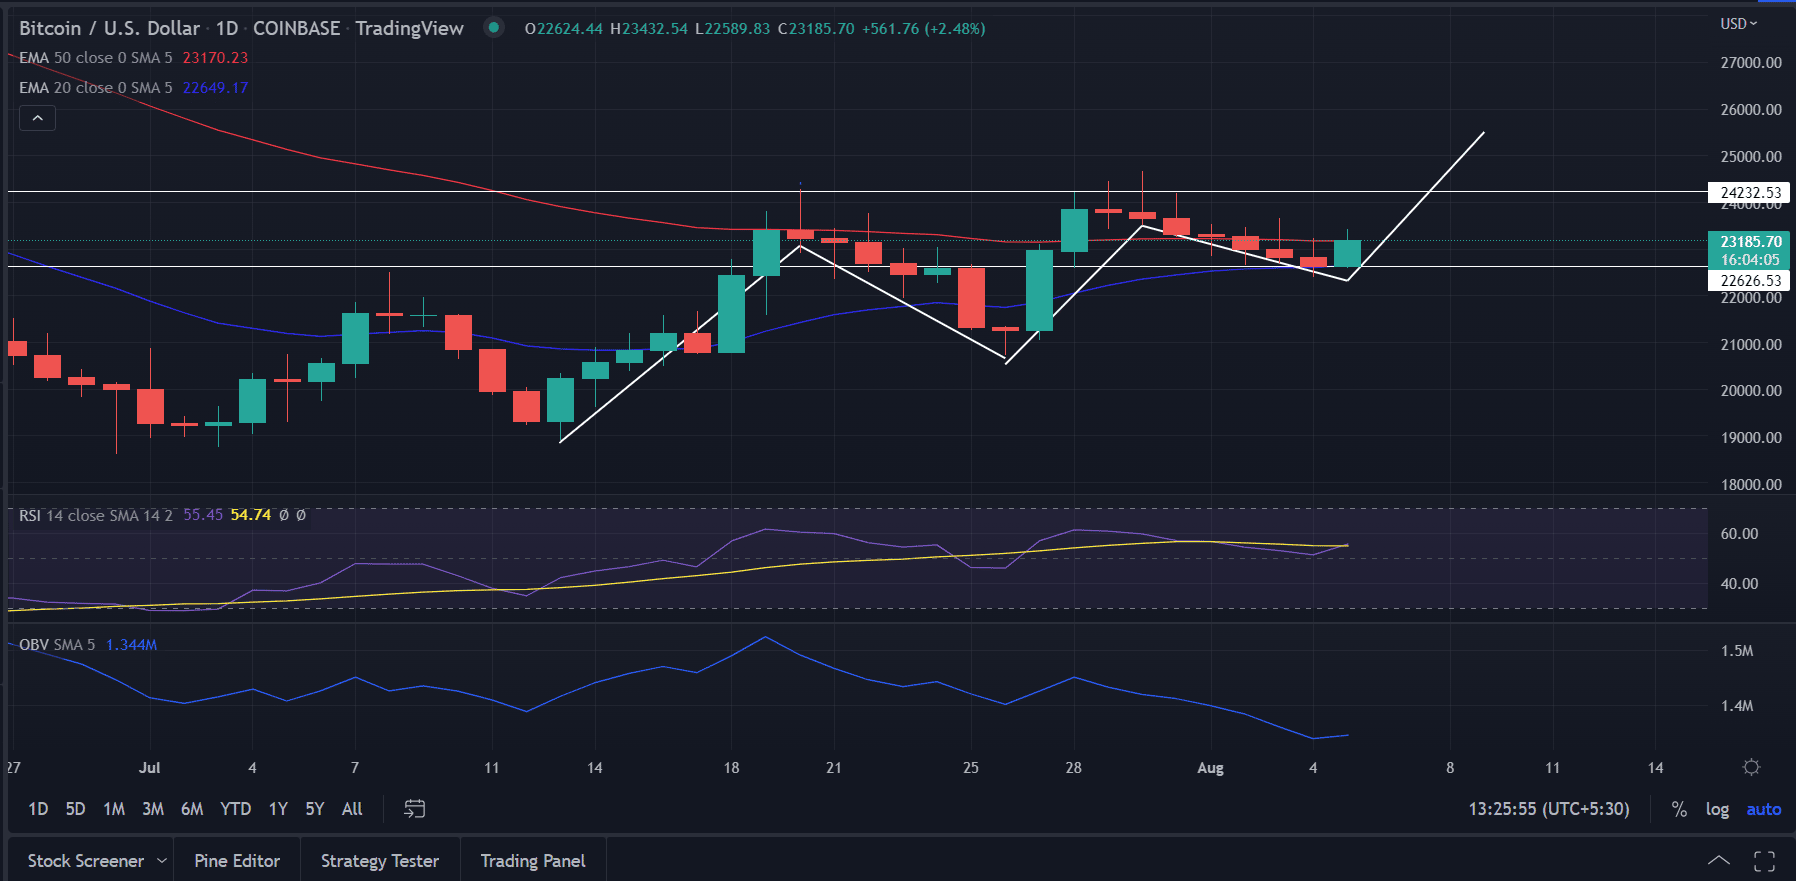
The formation of a green candlestick covering the previous two red candlestick indicates the strength of BTC. Further , the price is taking support near the crucial 20-day and 50-day EMA crossover. This indicates a bullish biasness in BTC sentiment.
An acceptance above $24,200 would pave the way for $25,500 followed by $26,000.
The RSI (14) attempts to cross above the average line and approachs the overbought zone. It reads at 55.
The On Balance Volume (OBV) indicator consolidated with bullish bias as the price spiked in 24 hours.
On the flip side, a break of the major-support zone around $22,600 would negate the bullish outlook in the asset. On the lower side, the sellers would meet $22, 300.
Play 10,000+ Casino Games at BC Game with Ease
- Instant Deposits And Withdrawals
- Crypto Casino And Sports Betting
- Exclusive Bonuses And Rewards


Why Trust CoinGape
CoinGape has covered the cryptocurrency industry since 2017, aiming to provide informative insights Read more…to our readers. Our journal analysts bring years of experience in market analysis and blockchain technology to ensure factual accuracy and balanced reporting. By following our Editorial Policy, our writers verify every source, fact-check each story, rely on reputable sources, and attribute quotes and media correctly. We also follow a rigorous Review Methodology when evaluating exchanges and tools. From emerging blockchain projects and coin launches to industry events and technical developments, we cover all facets of the digital asset space with unwavering commitment to timely, relevant information.

Related Articles


- Crypto Market Update: Top 3 Reasons Why BTC, ETH, XRP and ADA is Up
- Crypto News: Bitcoin Sell-Off Fears Rise as War Threatens Iran’s BTC Mining Operations
- U.S.–Iran War: Monday Crypto Crash Odds Rise As Pundits Predict Oil Price Spike
- US-Iran War: Reports Confirm Bombings In UAE, Bahrain and Kuwait As Crypto Market Makes Recovery
- XRP Price Dips on US-Iran Conflict, But Capitulation Signals March Rebound
- Bitcoin And XRP Price As US Kills Iran Supreme Leader- Is A Crypto Crash Ahead?
- Gold Price Prediction 2026: Analysts Expect Gold to Reach $6,300 This Year
- Circle (CRCL) Stock Price Prediction as Today is the CLARITY Act Deadline
- Analysts Predict Where XRP Price Could Close This Week – March 2026
- Top Analyst Predicts Pi Network Price Bottom, Flags Key Catalysts
- Will Ethereum Price Hold $1,900 Level After Five Weeks of $563M ETF Selling?


