 Buy $GGs
Bitcoin Price Analysis: Impending Range Breakout Signals Potential Surge to $34,000


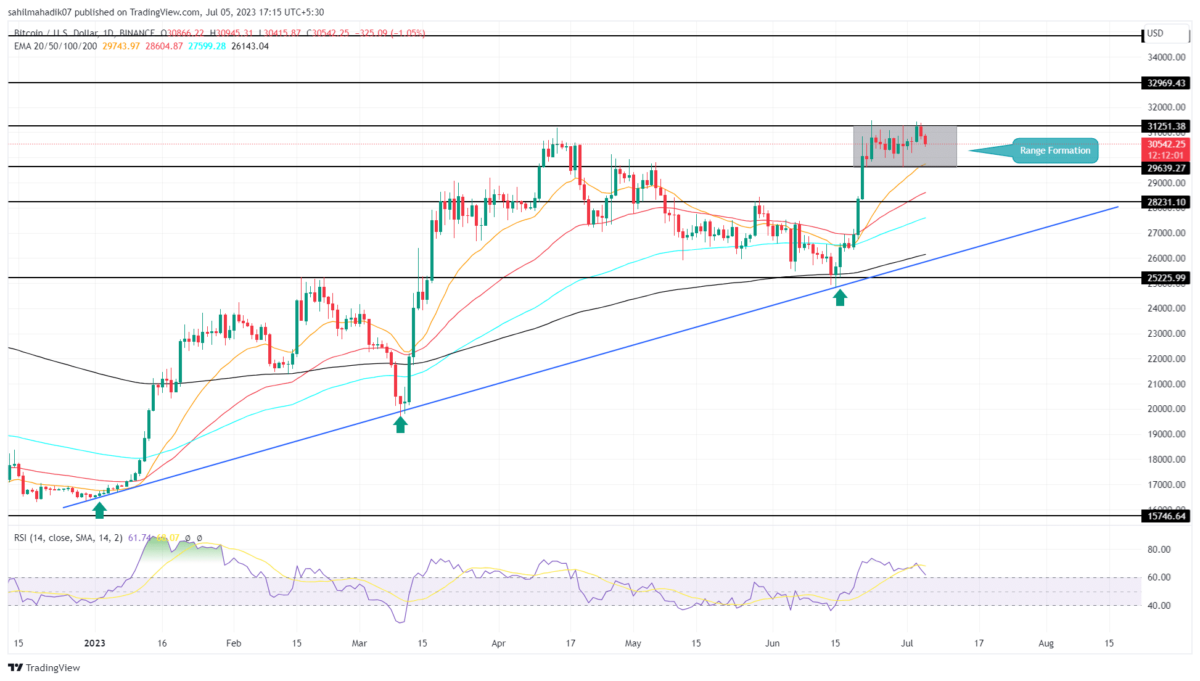
For over a fortnight, the leading cryptocurrency Bitcoin has been trading in a sideways trend resonating between $31250 and $29640. Despite the recent volatile sentiment in the market when the U.S. SEC expressed inadequate application for spot Bitcoin ETF, the coin price respected this range and stayed within boundaries. Therefore, this validated chart setup can be used to determine near future prospects of BTC price.
Also Read: Coinbase ($COIN) Price Jumps By 12% As BlackRock Files For Bitcoin ETF Again
Bitcoin Price Daily Chart
- Range formation offers buyers an opportunity to recuperate bullish momentum and prolong a bullish rally.
- A breakout above $31250 could set BTC for a quick 5% rise.
- The intraday trading volume in Bitcoin is $11.76 Billion, indicating a 27.5% loss.
 Source-Tradingview
On July 4th, the BTC price turned down from the range resistance level of $31250. This rejection reflects a fresh signal of reversal within the range, and also the continuation of sideways.
As of now, the Bitcoin price trades at $30575 with an intraday loss of 0.96%. The red candle printed today has breached below yesterday’s low, offering a suitable confirmation for price reversal.
The potential downfall could lead the coin price to 3% down to hit the range support of $29640. Interested traders can enter this pullback to accumulate BTC before the next leap.
However, even with a breakdown below $29640 support, the traders can maintain a bullish outlook until the buyers sustain the 50% retracement level near $28230.
Will Bitcoin Price Reach $34000?
The Bitcoin price entered this range following a massive rally during the second half of June. Such consolidations are common in trending markets as it’s also the buyers to rest before resuming the bullish rally. Thus, the coin price has a higher chance to break the $31250 barrier, offering buyers a solid footing to rise towards the next resistance of $33000, followed by $34850.
Play 10,000+ Casino Games at BC Game with Ease
- Instant Deposits And Withdrawals
- Crypto Casino And Sports Betting
- Exclusive Bonuses And Rewards


Why Trust CoinGape
CoinGape has covered the cryptocurrency industry since 2017, aiming to provide informative insights Read more…to our readers. Our journal analysts bring years of experience in market analysis and blockchain technology to ensure factual accuracy and balanced reporting. By following our Editorial Policy, our writers verify every source, fact-check each story, rely on reputable sources, and attribute quotes and media correctly. We also follow a rigorous Review Methodology when evaluating exchanges and tools. From emerging blockchain projects and coin launches to industry events and technical developments, we cover all facets of the digital asset space with unwavering commitment to timely, relevant information.

Related Articles


- TRON Price Bounces as SEC Drops Lawsuit Against Founder Justin Sun
- Top Crypto Exchanges to Trade Tokenized Real World Assets – Best Picks Reviewed
- Arthur Hayes Says Rising Oil Prices to Trigger Fed Money Printing, How Bitcoin Could Move?
- Crypto Market Bill Eyes Late March Markup as Key Senate Roadblocks Begin to Clear
- U.S. Federal Reserve, OCC Approves Banks to Handle Tokenized Securities With New Capital Rules
- HOOD Stock Targets $100 as Robinhood Unveils Platinum Card and Advance Dividend Feature
- Bitcoin Price Prediction if Donald Trump Signs the CLARITY Act on April 3, 2026
- Pi Network Price As BTC Rallies Above $74K: Can PI Coin Extend Gains to $0.30?
- XRP Price As Bitcoin Reclaims $74K- Is $5 Next?
- Dogecoin Price Outlook as BTC Recovers Above $73,000
- XRP Price Prediction as Iran-U.S. Peace Talks Trigger a Crypto Rally


