
Bitcoin Price Analysis: Will BTC Price Able To Add More Gains Above $24,000?


The Bitcoin price analysis shows a positive outlook for the day. The largest cryptocurrency by the market cap started the new series on a lower note as it remained pressured below the highs of July 30 at $$24,672.87. The price tested the reliable support around $22,650 multiple times. Even, in today’s session, the BTC price tested the same support level. But recovered sharply above $23,500.
On the four chart, the BTC price is displaying some bullish moves. But, the upside is capped near the $24,190 level. Hence, in the short-term BTC consolidate in the price range of $22,600 to $24,200.
It would be interesting to find out the directional bet of the breakout of the trading range.
As of writing, BTC/USD is exchanging hands at $23,509, up 2.36% for the day. According to the CoinMarketCap data, the largest cryptocurrency by the market cap holds the 24-hour trading volume at $26,881,814,757 with a loss of 8%.
BTC price extends consolidation
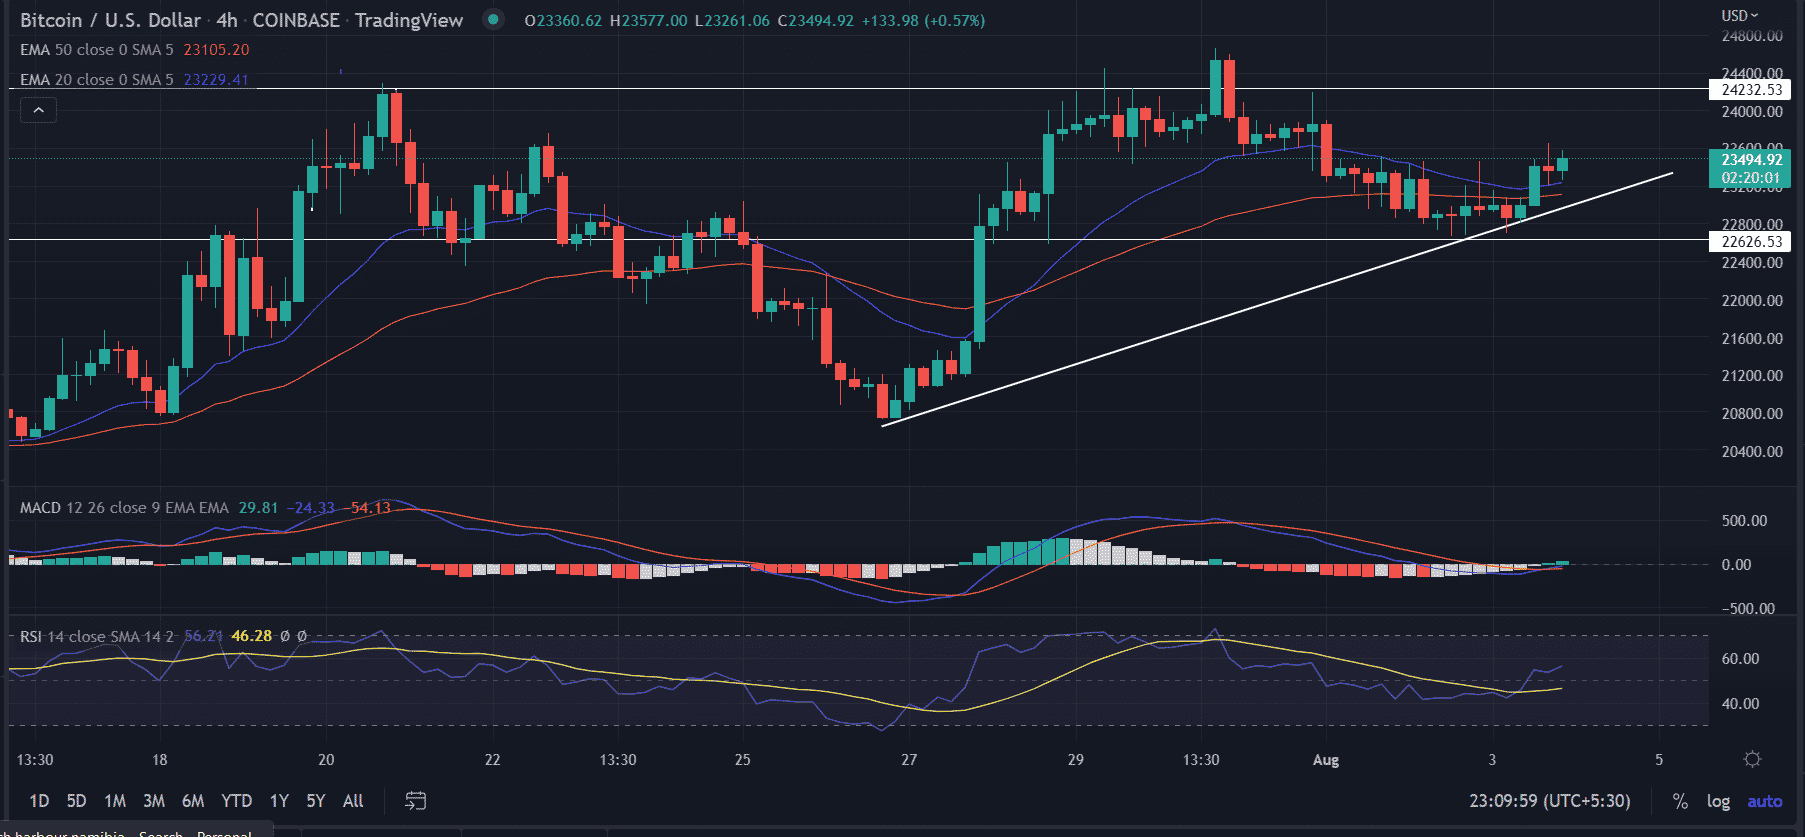
BTC price is trading along the ascending trend line from the lows of $20,730. After retracing from the swing highs of $24,666, the price takes well to support the critical 20-day and 50-day EMA crossover. As a result, the price manages to trade above the $23,500 level.
We expect BTC to hit the upper range of the defined trade range of $22,600 and $24,200 on the four-hour chart. More upside gains are possible if fresh buying emerges near the upper trading level. In that case, the next upside target for BTC buyers would be $26,000.
On the other hand, a break below $22,950 would mark the breach of the bullish trend line. Next, the stoppage would be $22,600 for the bears.
The RSI (14) holds above the average line with a bullish bias. Currently, it reads at 53.
Another momentum oscillator, the Moving Average Convergence (MACD) hovers just below the midline but in a good attempt to cross. An increasing bullish momentum as indicated by the histogram signaling a favorable situation for the bulls.
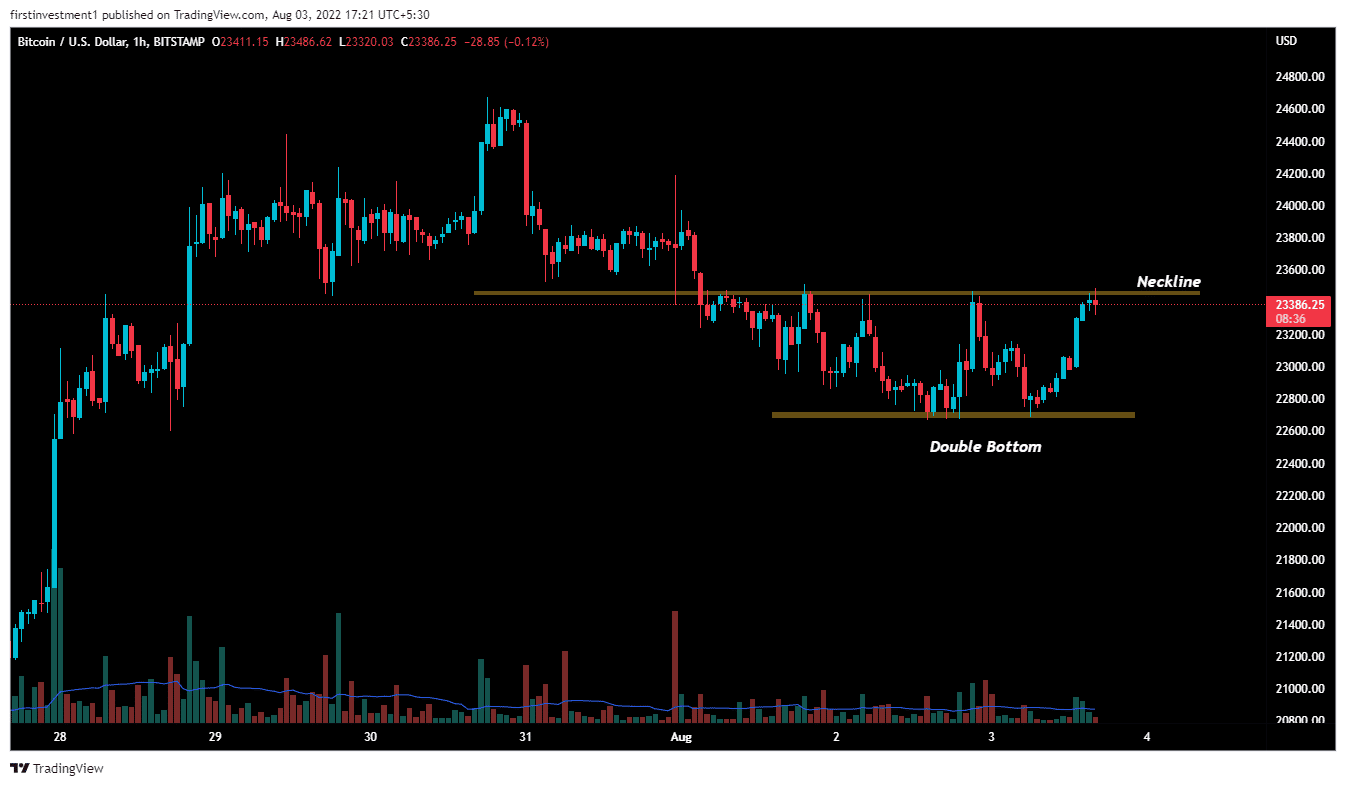
On the hourly time frame, the price formed a “Double Bottom pattern” indicating strong support near the lower levels. According to this pattern, if the price breaches the neckline above the $23,520 mark with good volumes, then the BTC price might test the $23,900 to $24,100 resistance zone.
On the other hand, a break below the $22,650 level could invalidate the bullish outlook. And the price can slide up to $22,100.
BTC/USD has often witnessed large price swings, gaining meaningful follow-through action once a clear direction has formed.
Play 10,000+ Casino Games at BC Game with Ease
- Instant Deposits And Withdrawals
- Crypto Casino And Sports Betting
- Exclusive Bonuses And Rewards


Why Trust CoinGape
CoinGape has covered the cryptocurrency industry since 2017, aiming to provide informative insights Read more…to our readers. Our journal analysts bring years of experience in market analysis and blockchain technology to ensure factual accuracy and balanced reporting. By following our Editorial Policy, our writers verify every source, fact-check each story, rely on reputable sources, and attribute quotes and media correctly. We also follow a rigorous Review Methodology when evaluating exchanges and tools. From emerging blockchain projects and coin launches to industry events and technical developments, we cover all facets of the digital asset space with unwavering commitment to timely, relevant information.


- Michael Saylor Hints at Another Strategy Bitcoin Buy With ‘Stretch the Orange Dots’ Post
- Will CLARITY Act Pass in 2026? Galaxy’s Alex Thorn Warns April Deadline Is Critical
- Tom Lee’s Bitmine Adds 5,000 ETH Despite $7.5B Unrealized Loss as BMNR Stock Rebounds
- CLARITY Act Should Ban Stablecoin Yields to Advance in Senate, French Hill Says
- U.S. Set to Deploy Warships to Keep the Strait of Hormuz Open, Bitcoin Climbs
- Solana vs XRP Price Forecast: Can SOL Reclaim Its All-Time High Before XRP Hits $2?
- Top Analyst Predicts Cardano Price Could Surge 100% As Bitcoin Breaks $72k
- What’s Keeping Shiba Inu Below $0.0000065- Analyst Predicts 30% Rise Ahead
- BTC Price to $100K by 2026? Kalshi and Polymarket Odds Climb to 42%
- Why Pi Network Price Surged 30% Today?
- What Happens to XRP Price If US Wins War Against Iran?


