 Buy $GGs
Bitcoin Price Eyes $32000 Mark after Clearing this Resistance


Over the past six weeks, the Bitcoin price showcases sideways action with no clear initiation from buyers or sellers. The short-body daily candles with long wicks on either side created a sentiment of uncertainty in the crypto market. Should you consider buying in the midst of increasing funds or selling now?
Also Read: New Bitcoin Addresses And Golden Cross Hints BTC Price Recovery
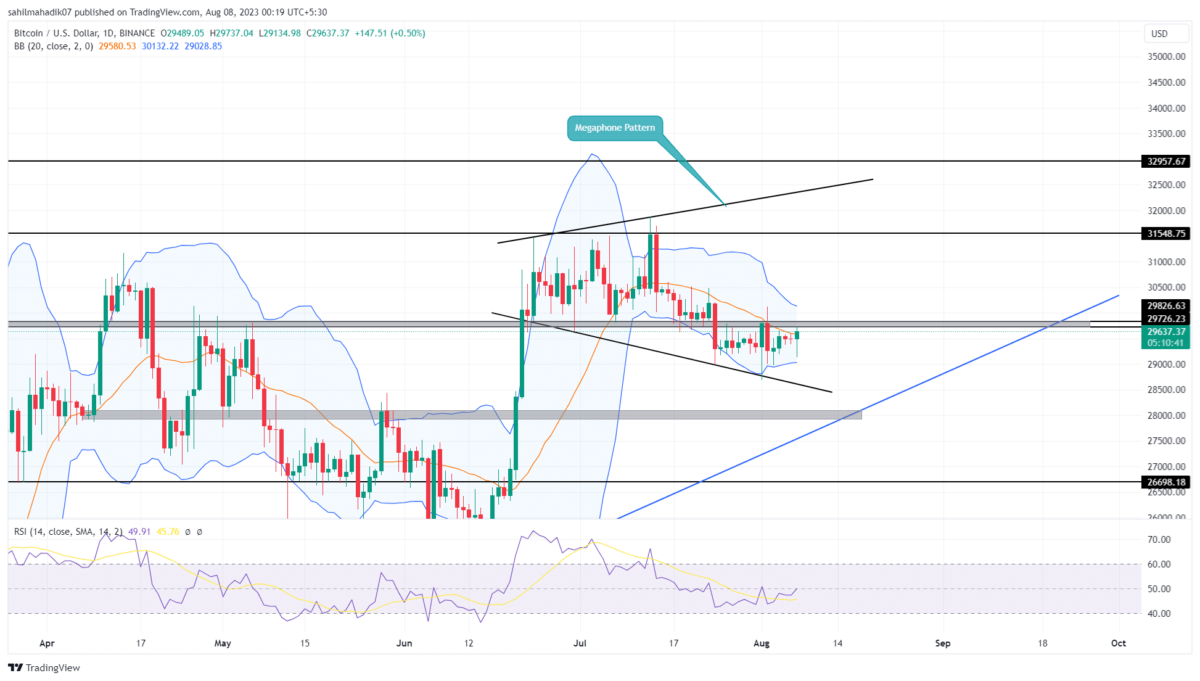
Bitcoin Price Daily Chart
- The megaphone pattern drives the current sideways action in Bitcoin
- The bottom support trendline could act as a strong accumulation zone for market buyers
- The intraday trading volume in Bitcoin is $12.6 Billion, indicating a 93% gain.
 Source- Tradingview
On July 24th, Bitcoin price experienced a bearish breakdown as it fell below the $29820-$29726 monthly. This move gave sellers an advantage, and the price seemed poised to drop another 4.5% to reach the next significant support at the ascending trendline.
The ascending trendline could act as strong support, as it carried sustained upward movement for the past seven months.
Interestingly, since the breakdown of the $29726, the price action has been moving sideways on the daily chart. Although the breakdown should have led to a significant downfall, the lack of strong selling pressure suggests that buyers are actively stepping in to support the price. This consolidation phase is an indication of weakness in the bearish momentum.
Therefore, despite the increasing uncertainty in the market, there is hope for a potential bullish recovery. Until this lower support trendline is intact, the coin holders can maintain their bullish outlook
[converter id=”btc-bitcoin” url=”https://coingape.com/price/converter/btc-to-usd/”]
Will BTC Price Rise Again?
There’s a possibility that the prior breakdown of $29726 was a bear trap, luring sellers into a false sense of security. If this scenario holds true, and buyers continue to support the price during this consolidation, it could lead to a bullish reversal. The increased buying pressure may drive Bitcoin price above the aforementioned level and potentially surge it above the $31000 mark.
- Bollinger Band: An upslope in the lower band on the Bollinger band indicator could offer additional support to traders.
- Relative Strength Index: The daily RSI slope rises above 50% hinting at the increased bullish momentum.
Play 10,000+ Casino Games at BC Game with Ease
- Instant Deposits And Withdrawals
- Crypto Casino And Sports Betting
- Exclusive Bonuses And Rewards


Why Trust CoinGape
CoinGape has covered the cryptocurrency industry since 2017, aiming to provide informative insights Read more…to our readers. Our journal analysts bring years of experience in market analysis and blockchain technology to ensure factual accuracy and balanced reporting. By following our Editorial Policy, our writers verify every source, fact-check each story, rely on reputable sources, and attribute quotes and media correctly. We also follow a rigorous Review Methodology when evaluating exchanges and tools. From emerging blockchain projects and coin launches to industry events and technical developments, we cover all facets of the digital asset space with unwavering commitment to timely, relevant information.

Related Articles


- Peter Brandt Flips Bullish, Predicts Bitcoin Rally As Price Holds Above $70k
- XRP News: Institutional Use Case Expands as Doppler Finance Integrates WXRP for Multi-Chain Access
- Trump Tariffs: Bitcoin Faces Fresh Headwinds as 15% Global Tariffs Begin This Week Amid Iran War
- Bitget Unveils ‘Crypto Anti-Bias Pledge’ To Support Women’s Inclusion In Crypto
- U.S.-Iran War: Crypto Market Rebounds as Iran Reportedly Reaches Out To U.S. To End Conflict
- XRP Price Prediction as Iran-U.S. Peace Talks Trigger a Crypto Rally
- COIN Stock Analysis as Bitcoin Retests $72k Ahead of February NFP Data
- Robinhood Stock Price Prediction As Cathie Wood Buys $12M Dip in Bold ARK Move
- Bitcoin Price At Risk? Professor Who Predicted US-Iran War Says America Could Lose
- Gold Price Prediction March 2026: Rally, Crash, or Record Highs?
- RIOT Stock Prediction as Needham, Piper Sandler Slash Target After Earnings


