 Buy $GGs
Bitcoin Price Is Preparing Its Next Move Within This Chart Pattern


The Bitcoin technical chart showcased a roller coaster ride as prices took a V-top reversal during Mid August and dumped back to 2022 bottom support of $18000. Moreover, over the last weeks, the crypto market suffered due to unfavorable news such as High CPI data, Fed interest hike, and the U.S. dollar index(DXY) rise to a 20-year high. As a result, the market participants’ fear of further downfall has increased.
Key points from Bitcoin price analysis:
- Bitcoin Fear & Greed Index has dropped to 24%, signaling extreme fear among market participants.
- Interested traders should wait for the Bitcoin price to breach the triangle pattern barriers before they position their funds.
- The intraday trading volume in Bitcoin is $22.6 Billion, indicating a 35% loss.
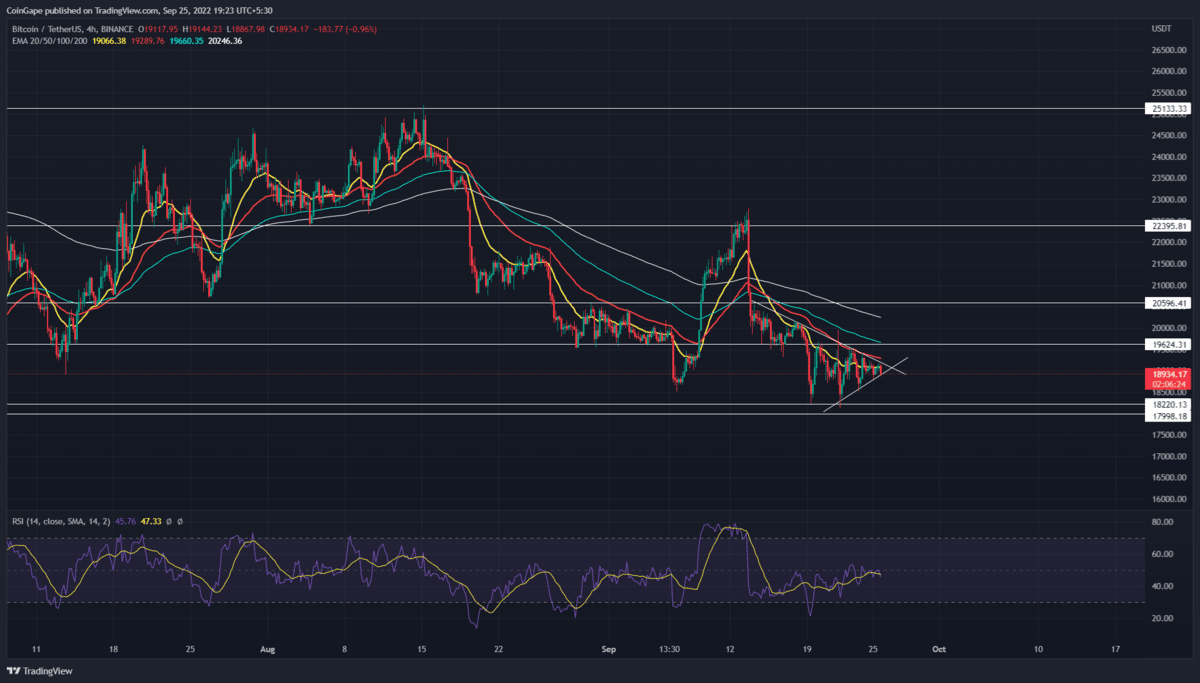
 Source-Tradingview
The Bitcoin retested the bottom support zone at $$18200-18000 on September 19th. However, even a week has nearly passed, the BTC price is still wavering around this support. This consolidation indicates uncertainty in market participants.
Anyhow, the 4-hour time frame chart reflects this consolidation as the formation of a symmetrical triangle pattern. In theory, this pattern usually resumes the prevailing trend after a short period of break; however, a breakout on the other side is quite possible.
Today, the Bitcoin price is trading at the $19062 mark and shows a 0.7 intraday gain. Furthermore, the two convergence trendlines have narrowed the prices enough to be considered a no-trading zone.
Therefore, a breakdown below the support trendline will intensify the ongoing bearish trend and plunge the Bitcoin price below the $18000 mark.
On a contrary note, a candle closing above the resistance trendline will signal an early sign of bullish reversal. As a result, the coin holders may witness another upswing.
Technical Indicator
RSI: Contrary to the sideways price action, the rising RSI slope indicates growth in underlying bullishness. Moreover, this positive divergence encourages a bullish breakout from the triangle pattern.
EMAs: the downsloping crucial EMAs(20, 50, 100, and 200) indicate any potential rally would face multiple resistance on its way up.
- Resistance level- $19600 and $20600
- Support level- $18000 and $16500
Play 10,000+ Casino Games at BC Game with Ease
- Instant Deposits And Withdrawals
- Crypto Casino And Sports Betting
- Exclusive Bonuses And Rewards


Why Trust CoinGape
CoinGape has covered the cryptocurrency industry since 2017, aiming to provide informative insights Read more…to our readers. Our journal analysts bring years of experience in market analysis and blockchain technology to ensure factual accuracy and balanced reporting. By following our Editorial Policy, our writers verify every source, fact-check each story, rely on reputable sources, and attribute quotes and media correctly. We also follow a rigorous Review Methodology when evaluating exchanges and tools. From emerging blockchain projects and coin launches to industry events and technical developments, we cover all facets of the digital asset space with unwavering commitment to timely, relevant information.

Related Articles


- Vitalik Buterin Maps Out Quantum Risks as Ethereum Foundation Unveils ‘Strawmap’
- BlackRock Adds $289M in BTC as Bitcoin ETFs Log 2-Week High Inflows Of $500M
- Glassnode Signals Bitcoin Still Faces Downside Risk Amid Massive Sell Pressure at $70K
- U.S House Introduces Bipartisan Crypto Bill To Protect Crypto Developers Amid DeFi Push Under CLARITY Act
- XRP News: Ripple Unveils Funding Hub To Support Innovation On XRPL
- Top 2 Price Predictions Ethereum and Solana Ahead of March 1 Clarity Act Stablecoin Deadline
- Pi Network Price Prediction Ahead of Protocol Upgrades Deadline on March 1
- XRP Price Outlook As Jane Street Lawsuit Sparks Shift in Morning Sell-Off Trend
- Dogecoin, Cardano, and Chainlink Price Prediction As Crypto Market Rebounds
- Will Solana Price Rally to $100 If Bitcoin Reclaims $72K?
- XRP Price Eye $2 Rebound as On-Chain Data Signals Massive Whale Accumulation


