 Buy Presale
Bitcoin Price Prediction As Buyers Break 90 Days Correction Trend


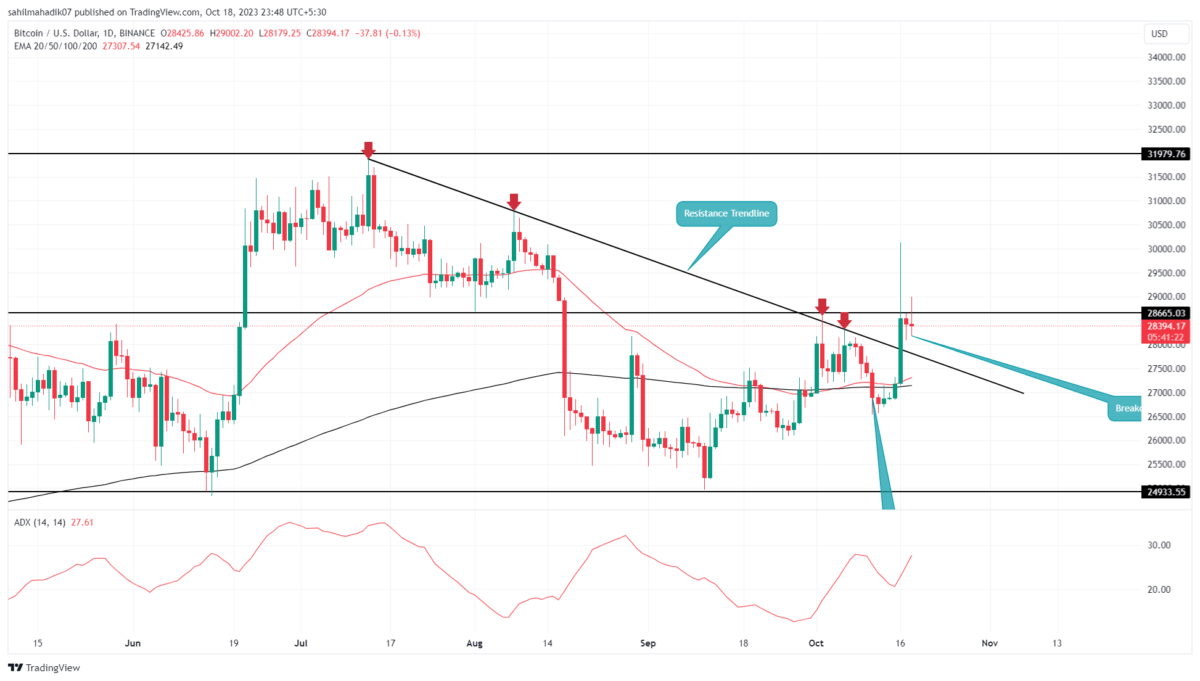
On October 16th, the BTC price experienced a significant inflow of buying pressure, resulting in a decisive breakout above a downward-sloping resistance trendline. This trendline had been guiding the coin’s three-month correction, and its breach signaled a new potential recovery phase. However, the surge was largely driven by unconfirmed rumors regarding the approval of Bitcoin’s spot ETF, raising questions about the sustainability of this breakout.
Also Read: Bitcoin Hits $29K, SEC In Constructive Talks With Bitcoin ETF Issuers: Bloomberg Analyst
Is Current Recovery Heading to $32000?
- The daily candles with higher price rejection indicate supply pressure around $29000
- The BTC price sustainability above $28000 could set a 12% upswing
- The intraday trading volume in Bitcoin is $24 Billion, indicating a 373% gain.
 Source-Tradingview
Since the early weeks of September, the Bitcoin price embarked on a relief rally, rebounding from a psychological support level of $25,000. Over the past five weeks, the coin has appreciated nearly 13.5%, reaching a current trading price of $28,380.
During this uptrend, the coin executed a significant breakout from a resistance trendline, which had been framing the three-month-long correction. Despite this, the lack of confirmation regarding the speculative Bitcoin ETF news hindered the coin’s progress beyond the $29,000 mark.
Currently posting an intraday loss of 0.2%, the BTC is poised for a retest of the newly established support level. This retest will be crucial in determining whether the breakout can be sustained and whether the recovery can be extended.
Should bullish momentum continue, this coin could target a 12% gain, reaching the $32,000 level.
[converter id=”btc-bitcoin” url=”https://coingape.com/price/converter/btc-to-usd/”]
Bull Trap May Push BTC Price Back to Correction Track
If the recent surge proves to be merely sentiment-driven and fails to maintain levels above the breached trendline, we could see the BTC plunge back below. Such a breakdown would invalidate the October 16th breakout, categorizing it as a ‘bull trap,’ thereby ramping up selling pressure in the market. In this bearish scenario, the coin could experience a 10% drop, potentially revisiting the $25,000 support level.
- Average Directional Index: An uptick in the daily ADX slope indicates the buyers have the strength to prolong the recovery trend.
- Exponential Moving Average: The flattish 50-and-200-day EMA slope reflects the sideways trend.
Play 10,000+ Casino Games at BC Game with Ease
- Instant Deposits And Withdrawals
- Crypto Casino And Sports Betting
- Exclusive Bonuses And Rewards


Why Trust CoinGape
CoinGape has covered the cryptocurrency industry since 2017, aiming to provide informative insights Read more…to our readers. Our journal analysts bring years of experience in market analysis and blockchain technology to ensure factual accuracy and balanced reporting. By following our Editorial Policy, our writers verify every source, fact-check each story, rely on reputable sources, and attribute quotes and media correctly. We also follow a rigorous Review Methodology when evaluating exchanges and tools. From emerging blockchain projects and coin launches to industry events and technical developments, we cover all facets of the digital asset space with unwavering commitment to timely, relevant information.

Related Articles


- Crypto Market Soars on Rumors of Trump’s 0% Tax Policy for Digital Assets
- Hong Kong Set to Launch Tokenized Bond Platform and Issue First Stablecoin Licenses
- US Senator Launches Probe Into Binance After Fortune Report on Sanctions Violations
- CLARITY Act Odds, Bitcoin Drop as Trump Skips Crypto in State of the Union Speech
- Tokenized Stock Market Gains Boost as Kraken and Binance Launches New Products
- Cardano Price Signals Rebound as Whales Accumulate 819M ADA
- Sui Price Eyes Recovery as Third Spot SUI ETF Debuts on Nasdaq
- Pi Network Price Eyes a 30% Jump as Migrations Jumps to 16M
- Will Ethereum Price Dip to $1,500 as Vitalik Buterin Continues Selling ETH?
- XRP Price Outlook as Clarity Act Passage Odds Plunge to 53%
- COIN Stock Risks Crashing to $100 as Odds of US Striking Iran Jump


