 Buy $GGs
Bitcoin Price Prediction as MSTR Stock Crashes- Should Investors Worry?


Highlights
- MSTR stock slumps 8% as Michael Saylor eases issuance rules to raise Bitcoin funds.
- Shrinking mNAV premium highlights growing equity dilution concerns tied to Bitcoin strategy.
- Bitcoin price tests $112K support zone, with chart analysis favoring a potential breakout rally.
The Bitcoin price has faced pressure together with the poor performance of Michael Saylor Strategy (MSTR) stock. The market mood has shifted as Michael Saylor revised its issuance policies, which has caused uncertainty. Even after the correction, Bitcoin still trades within a key structure.
Bitcoin Price Tied to MSTR as Stock Crash Sparks Fresh Uncertainty
The Bitcoin price is still under pressure following the collapse of Michael Saylor Strategy (MSTR) stock which dropped by 8% this week, hitting its lowest in four months. The decline mirrors the 8.6% drop in Bitcoin since it hit its recent high of $124,128, emphasizing the high correlation between the stock and the cryptocurrency.
At the core of this connection is the mNAV ratio, which measures MSTR’s stock price premium over its Bitcoin holdings. Previously, the MSTR stock traded at 3.4x of its Bitcoin holdings, but this premium has since reduced to 1.6x.
The move by Saylor to lower the issuance restriction to below 2.5x was an act of urgency that raised concerns of equity dilution. This gave it cash to continue buying more Bitcoin but had a negative impact on investor sentiment.
The Bitcoin price response shows the level of sensitivity of market participants to the equity actions of MSTR. As the valuation of MSTR thins, the direct effect on the liquidity path of Bitcoin strengthens.
Can Bitcoin Break Free or Sink Below Support?
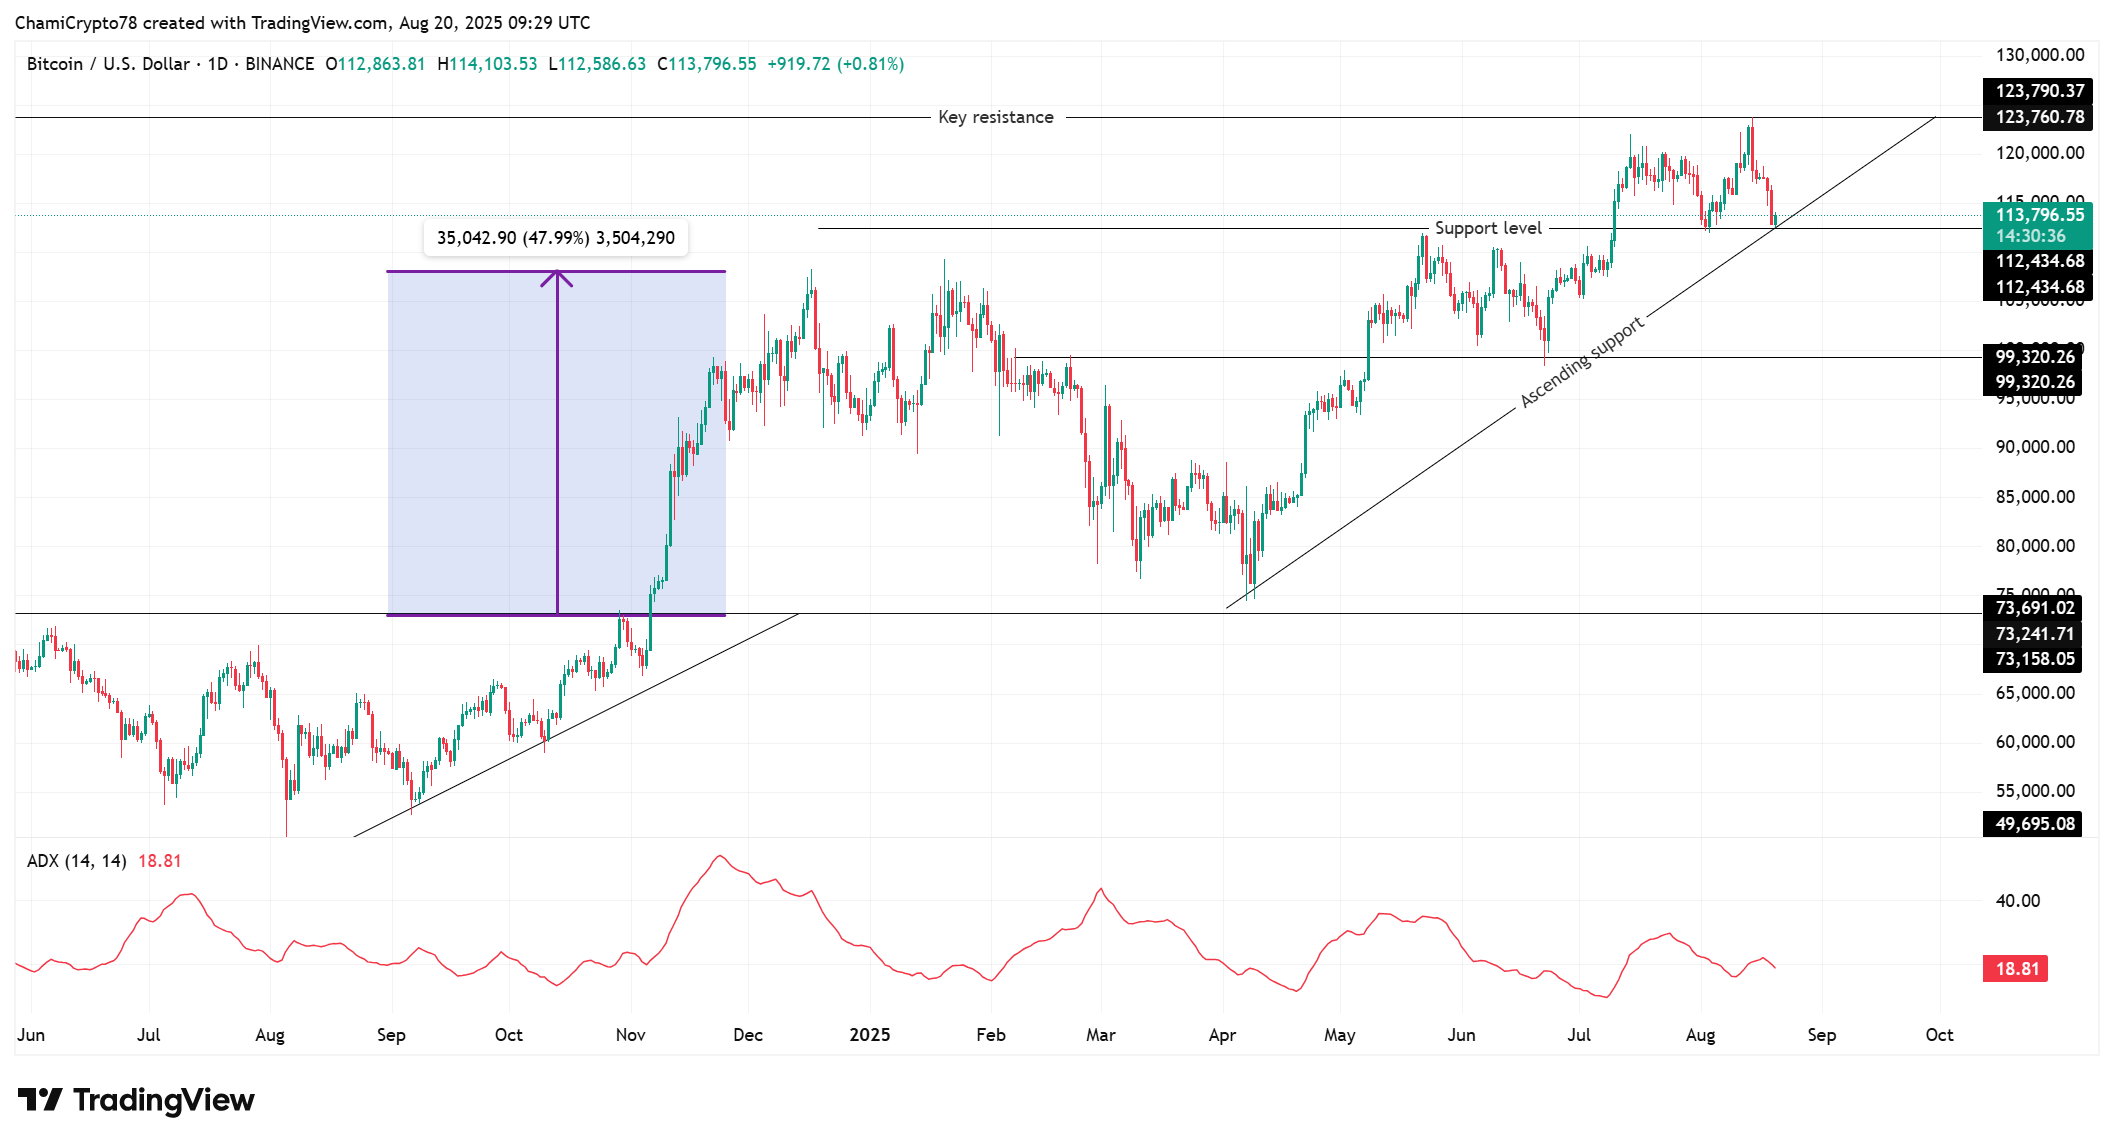
The Bitcoin price continues to respect its ascending support structure, with the price holding above the $113,000 mark despite the recent weakness. The chart identifies $112400 as the immediate support with the trendline serving as a backup.
A clean break below this area would open downside potentials towards levels near $99,300, an area where the market had consolidated earlier in the year. On the upside, $123,700 is the resistance, and only a bullish breakout beyond this level would signal revival.
The revised MSTR funding approach introduces an additional level of demand, indicating that institutional-level accumulation is not over even when volatility increases. The ADX indicator sits at 18.81 indicating that the directional momentum is weak, but is often a precursor to strong market moves.
In the previous accumulation period, the same setup resulted in a 47% rally. Should Bitcoin rebound and hold the ascending trendline, the next leg up could revisit the previous highs of $124,000 and possibly even higher.
However, failure to hold on to $112,000 support would probably pull the price back to around $99,000, postponing a bullish run. Therefore, the historical performance and the preserved structure incline the long term Bitcoin price forecast to the bullish side, implying an upswing rather than a further decline.
To sum up, the Bitcoin price is more likely to rally than decline, as institutional accumulation via MSTR supports long-term demand as technical structure remains intact. Holding above $112,000 confirms the broader bullish trend despite recent market volatility. A decisive break above $120,000 would validate renewed strength and open the door to new highs.
Play 10,000+ Casino Games at BC Game with Ease
- Instant Deposits And Withdrawals
- Crypto Casino And Sports Betting
- Exclusive Bonuses And Rewards

Frequently Asked Questions (FAQs)
1. How does MSTR’s stock crash affect the Bitcoin price?
2. What are the key Bitcoin support and resistance levels right now?
3. Is Bitcoin more likely to rally or decline in the coming weeks?

Why Trust CoinGape
CoinGape has covered the cryptocurrency industry since 2017, aiming to provide informative insights Read more…to our readers. Our journal analysts bring years of experience in market analysis and blockchain technology to ensure factual accuracy and balanced reporting. By following our Editorial Policy, our writers verify every source, fact-check each story, rely on reputable sources, and attribute quotes and media correctly. We also follow a rigorous Review Methodology when evaluating exchanges and tools. From emerging blockchain projects and coin launches to industry events and technical developments, we cover all facets of the digital asset space with unwavering commitment to timely, relevant information.

Related Articles


- Polymarket U.S.–Iran Strike Bets Fuel Insider Trading Speculation as Crypto Traders Net $1.2M
- Cardano’s DeFi TVL Climbs as USDCx Stablecoin Launches on Network
- Gold vs. Bitcoin: Can Gold Outperform BTC Amid US–Iran Conflict?
- Bitcoin Faces $1.8B in Panic Selling as U.S.-Iran Airstrikes Escalate; Will BTC Crash Below $60k?
- Gold ETF vs Tokenized Gold: Who Could Outperform in 2026?
- Top Analyst Predicts Pi Network Price Bottom, Flags Key Catalysts
- Will Ethereum Price Hold $1,900 Level After Five Weeks of $563M ETF Selling?
- Top 2 Price Predictions Ethereum and Solana Ahead of March 1 Clarity Act Stablecoin Deadline
- Pi Network Price Prediction Ahead of Protocol Upgrades Deadline on March 1
- XRP Price Outlook As Jane Street Lawsuit Sparks Shift in Morning Sell-Off Trend
- Dogecoin, Cardano, and Chainlink Price Prediction As Crypto Market Rebounds


