Bitcoin Price Prediction: Defends $37k Support Level; Keep Eyes On $42K Next


Bitcoin price is making familiar moves on Monday as it is hovering near $39,000. BTC found reliable support of around $37,000 since late January. Sellers collect liquidity and bounce back toward the upper trading zone placed at the supply zone extending from $45,000 and $42,000.
- Bitcoin price trades with significant gains as the fresh trading week begins.
- Moves in a familiar trading range of $37k and $42k for a month.
- BTC could test $42,000 next as bulls attempt to cross the descending trendline.
Bitcoin price looks for a breakout
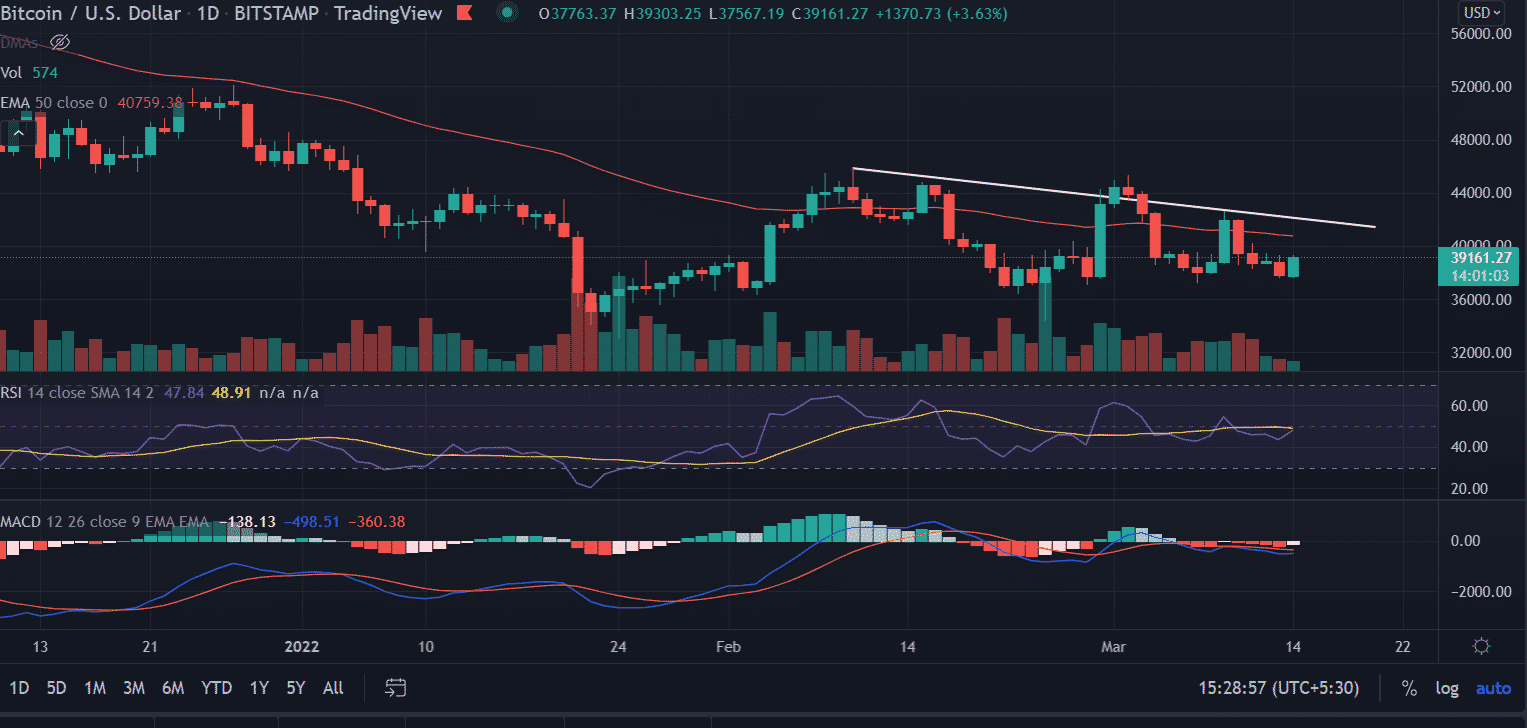
Bitcoin price remains pressured near $39,000 and is making effort to move higher. In today’s session, BTC opened lower but quickly recovered to test sessions’ high at $39,220.0. On the daily chart, the price face multiple rejections near the descending trendline, which is extending from the highs of $45,850 made on February 10. Further, the Bitcoin price failed to slice above the bearish trendline in February.
Bitcoin price hit record lows in late January at $32,950.72 and surged 35% to the swing highs of $45,850.0, the level which acted as a strong upside barrier for the bulls. BTC retreated further by 17% but made a higher low at $24,324.05, extending the demand zone now at $37,169.52. Thus making a formation of higher lows with receding higher levels.
As per the technical formation, a bounce is expected at the current price level. The immediate first target is placed at 50-day EMA (Exponential Moving Average) at $40,756.05.
A decisive breakout of the bearish trend line will bring $44,000 in play with the condition of above an average volumes.
On the contrary, if the price breaks below the session’s low as a shift in bullish sentiment then Bitcoin price could revisit the horizontal $36,000 level.
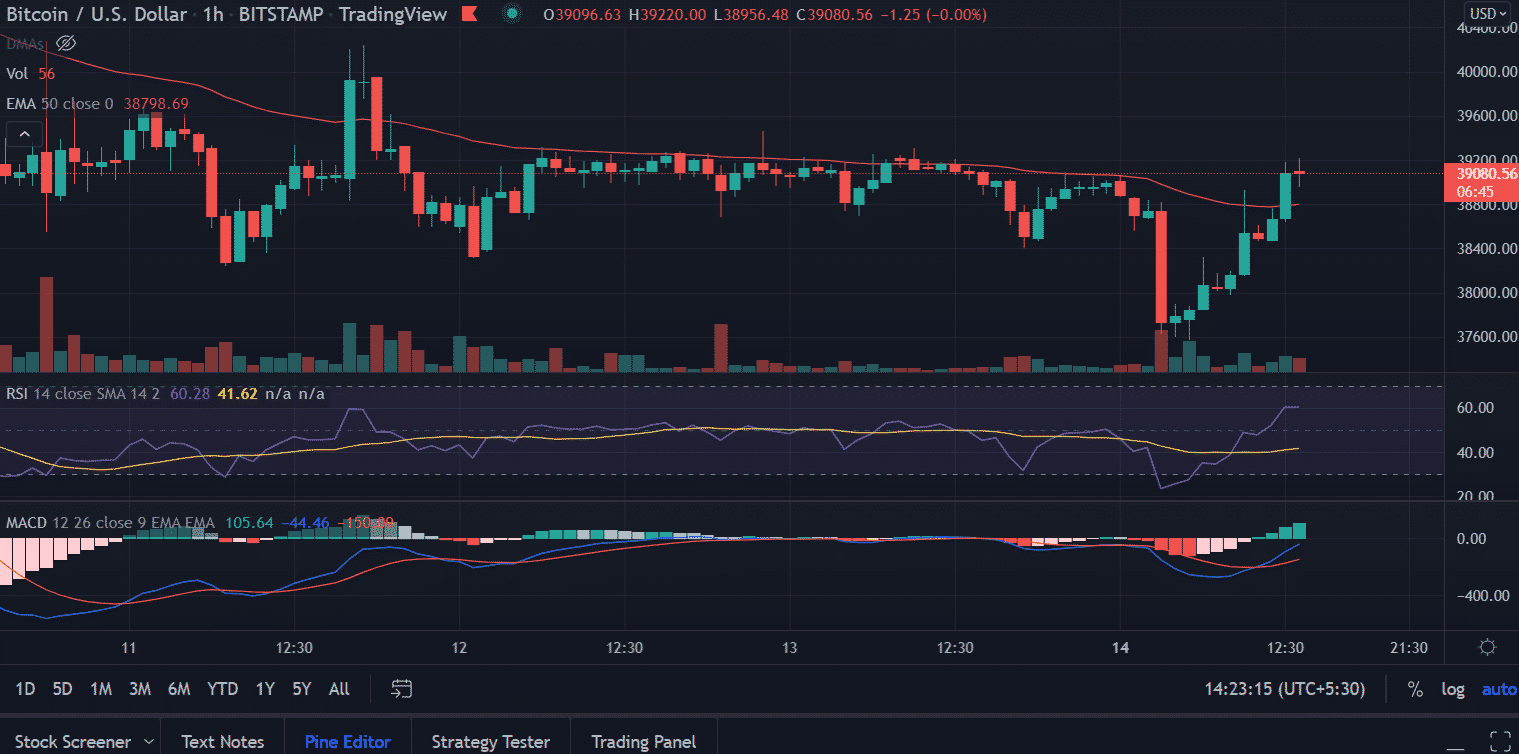
On the 1-hour chart frame, Bitcoin price is facing a tough time to pierce above the stiff resistance zone placed at $39,200. But it recovered sharply from the session’s low with good volumes.
Technical indicators:
RSI: The daily relative strength index attempts to break above the average line with a bullish bias.
MACD: The Moving Average Convergence Divergence hovers below the midline. But the indicator tilt in a positive direction with upside momentum

Why Trust CoinGape
CoinGape has covered the cryptocurrency industry since 2017, aiming to provide informative insights Read more…to our readers. Our journal analysts bring years of experience in market analysis and blockchain technology to ensure factual accuracy and balanced reporting. By following our Editorial Policy, our writers verify every source, fact-check each story, rely on reputable sources, and attribute quotes and media correctly. We also follow a rigorous Review Methodology when evaluating exchanges and tools. From emerging blockchain projects and coin launches to industry events and technical developments, we cover all facets of the digital asset space with unwavering commitment to timely, relevant information.

Related Articles


- Prediction Market News: Kalshi Faces New Lawsuit Amid State Regulatory Crackdown
- Will Bitcoin Crash To $58k or Rally to $75k After Hot PCE Inflation Data?
- Ripple’s RLUSD Gets Institutional Boost as SEC Eases Stablecoin Rules for Broker-Dealers
- Crypto Market Weekly Recap: BTC Waver on Macro & Quantum Jitters, CLARITY Act Deadline Fuels Hope, Sui ETFs Go Live Feb 16-20
- Robert Kiyosaki Adds To Bitcoin Position Despite Market Decline
- XRP Price Prediction As SBI Introduces Tokenized Bonds With Crypto Rewards
- Ethereum Price Rises After SCOTUS Ruling: Here’s Why a Drop to $1,500 is Possible
- Will Pi Network Price See a Surge After the Mainnet Launch Anniversary?
- Bitcoin and XRP Price Prediction As White House Sets March 1st Deadline to Advance Clarity Act
- Top 3 Price Predictions Feb 2026 for Solana, Bitcoin, Pi Network as Odds of Trump Attacking Iran Rise
- Cardano Price Prediction Feb 2026 as Coinbase Accepts ADA as Loan Collateral


