Bitcoin Price Prediction: Is $BTC Ready to Reclaim $30k Mark?


Bitcoin Price Prediction: The BTC Price recovery is encountering strong resistance around the $30,000 mark, as evidenced by short-body candles and higher wicks in the daily time frame. Within a week, the buyers witnessed several failed attempts to breach the psychological level, indicating the overhead supply was aggressive. As the sellers continue to defend this coin is poised for a minor pullback before making the next leap.
Also Read: Bitcoin (BTC) Price Forms Support as $30K as Dominance Returns to Multi-Year High
Will BTC Price Recovery Hit $32000?
- The $30000 level stands as the crucial resistance level of coinholders
- A potential pullback in ETH price could recuperate the bullish momentum and attract more buyers to the market
- The intraday trading volume in Bitcoin is $12 Billion, indicating a 17% gain.
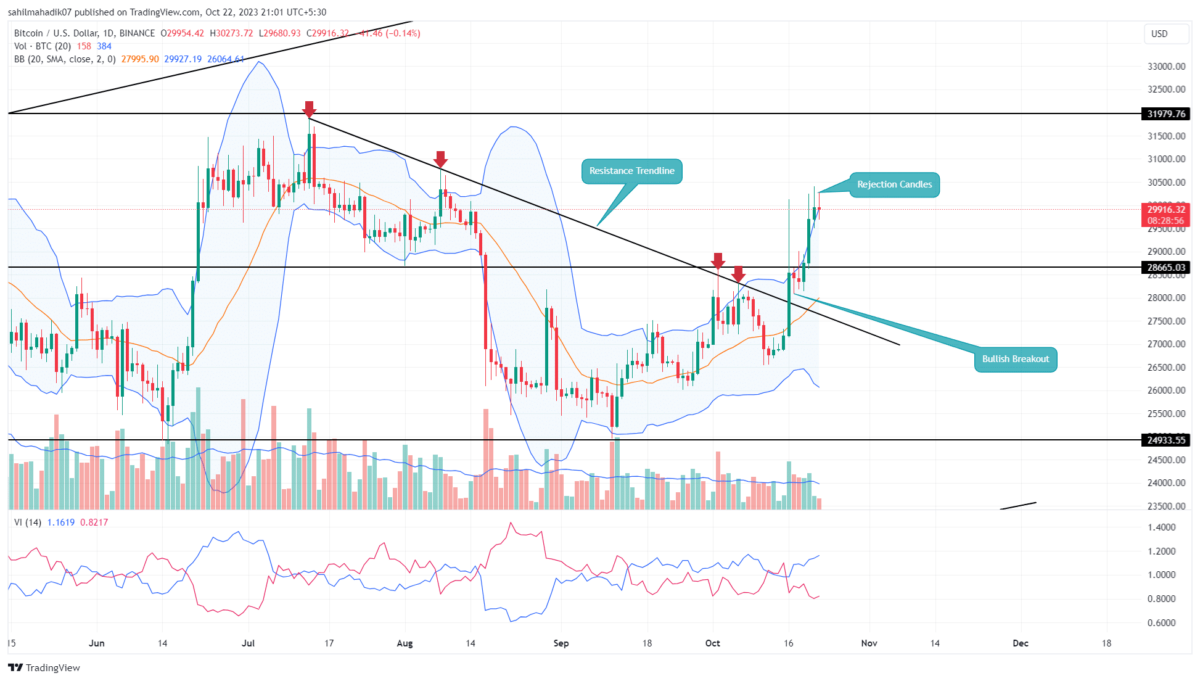
 Source-Tradingview
The Bitcoin price recovery picked up momentum after giving a decisive breakout from the downsloping monthly resistance on October 16th. The post-breakout rally pushed the coin price from $28,000 to the current trading price of $30,000, registering a 6.5% jump.
However, the recovery trend has witnessed a major roadblock around $30,000 evidenced by a higher price rejection candle in the daily chart. This overhead supply pressure could trigger a minor pullback and push the BTC price to the previously breached resistance of $28600.
Interestingly, the BTC price had witnessed two similar pullbacks recently, and it never plunged below the 61.8% Fibonacci retracement level.
Thus, for the anticipated pullback, the $28,633 and $27,000 stand as crucial support that could bolster buyers for higher recovery. The post-correction rally would likely surpass the $30000 mark and hit a July 13th high of $32000.
[converter id=”btc-bitcoin” url=”https://coingape.com/price/converter/btc-to-usd/”]
BTC vs ETH Performance
 Source: Coingape| Bitcoin Vs Ethereum Price
In a comparative analysis spanning the last six months, Bitcoin and Ethereum have displayed different price behaviors. While the Ethereum price has been in a correction phase characterized by lower highs and lower lows, the BTC price has managed to maintain a more stable, sideways trajectory which suggests a better position for a recovery trend.
- Bollinger Band: An uptick in the upper boundary of the Bollinger Band indicator reflects the bullish momentum is active.
- Vortex Indicator A bullish alignment between the VI+(blue_ and VI-(pink) slope reflects the current recovery trend is intact.

Why Trust CoinGape
CoinGape has covered the cryptocurrency industry since 2017, aiming to provide informative insights Read more…to our readers. Our journal analysts bring years of experience in market analysis and blockchain technology to ensure factual accuracy and balanced reporting. By following our Editorial Policy, our writers verify every source, fact-check each story, rely on reputable sources, and attribute quotes and media correctly. We also follow a rigorous Review Methodology when evaluating exchanges and tools. From emerging blockchain projects and coin launches to industry events and technical developments, we cover all facets of the digital asset space with unwavering commitment to timely, relevant information.
24 Hours volume
$31.23B
Market Cap
$1.33T
Max Supply
21M