Bitcoin Price Prediction As Supply Pressure at $35K Threatens for New Correction


Bitcoin Price Prediction: In the midst of a broader recovery across the cryptocurrency market, the BTC price has been spearheading the rally since the third week of October. Although the majority of major cryptocurrencies have generally benefited from this uplift, the Bitcoin price momentum appears to be stalling at the pivotal $35,000 level. This has led to questions about whether the current recovery has reached its limit.
Also Read: What Shall BTC Investors Do Ahead of the Bitcoin Options Expiry?
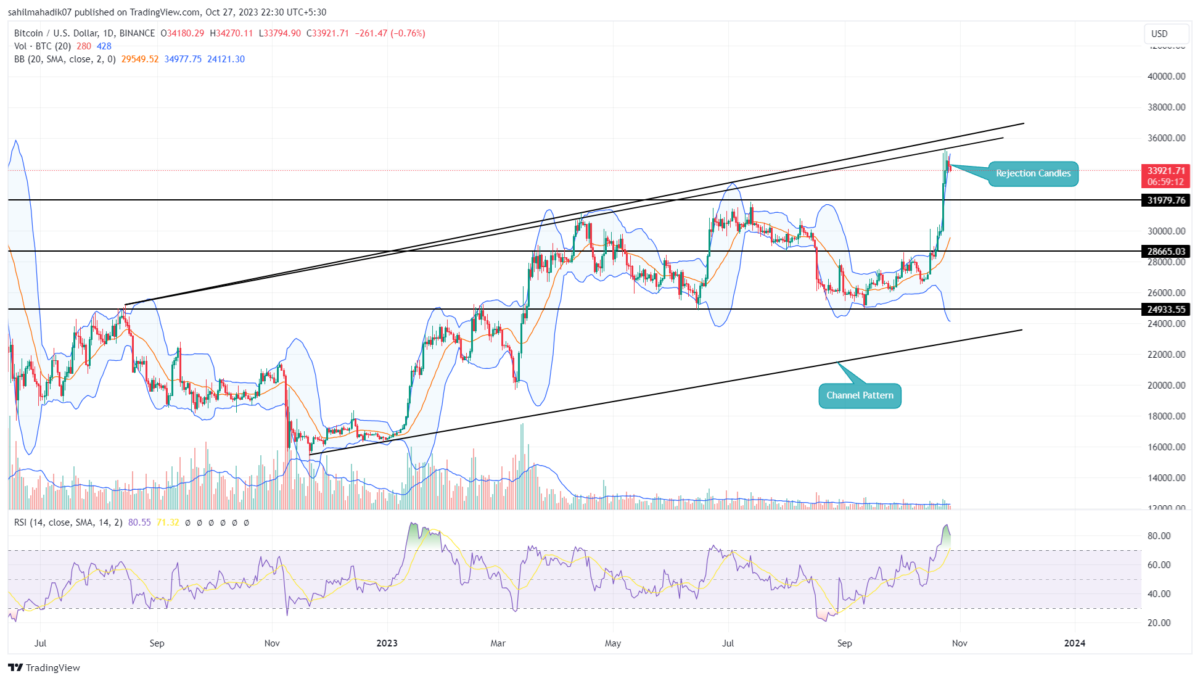
Channel Pattern Leads Long-Term Uptrend
- The long-tail rejection candles at $35000 indicate the overhead supply is active
- A potential breakout from the channel pattern could trigger a directional rally.
- The intraday trading volume in Bitcoin is $15.4 Billion, indicating a 27% loss.
 Source-Tradingview
From a low of $26,833 on October 14th, the Bitcoin price has soared to a high of $35,263, marking an impressive 31.4% gain. This upswing aligned with rising trading volumes and bullish market sentiment, indicating a sustainable recovery.
However, the asset has hit a stumbling block at the $35,000 level, where it’s retested the upper trendline of a long-standing channel pattern. This pattern has been driving this bullish rally for over a year, and its trendline has been acting as dynamic resistance and support.
As of now, the BTC is trading at $33,958, displaying candles with long wicks at this resistance level, suggesting a potential reversal.
According to Fibonacci retracement levels, should a significant correction occur, the price could find support at $33,000 (aligned with the 23.6% Fib level) and then at $31,380 (corresponding to the 38.2% Fib level).
Is BTC Price Recovery Hit $40000?
As long as the rising channel pattern remains intact, the BTC price recovery is likely to be gradual but may lack depth. To shift the narrative, a decisive break above this resistance trendline is crucial. Such a move would ramp up buying pressure and could propel the Bitcoin price beyond the $40,000 mark
- Bollinger Band: The upper boundary of Bollinger Bands challenged on the upside reflects the bullish momentum and is still aggressive.
- Relative Strength Index: the RSI slope at 81.0% reflects the asset is overbought and thus a need for a minor pullback to recuperate buying momentum.

Why Trust CoinGape
CoinGape has covered the cryptocurrency industry since 2017, aiming to provide informative insights Read more…to our readers. Our journal analysts bring years of experience in market analysis and blockchain technology to ensure factual accuracy and balanced reporting. By following our Editorial Policy, our writers verify every source, fact-check each story, rely on reputable sources, and attribute quotes and media correctly. We also follow a rigorous Review Methodology when evaluating exchanges and tools. From emerging blockchain projects and coin launches to industry events and technical developments, we cover all facets of the digital asset space with unwavering commitment to timely, relevant information.
24 Hours volume
$16.18B
Market Cap
$1.34T
Max Supply
21M